Web UI
The platform ships a web application over the components the framework defines: browse what is installed, configure sources and their credentials, attach destinations, schedule jobs, react to outcomes with hooks, and follow every run down to its events. Nothing on these screens is written per connector; each page is rendered from component definitions, as Generated from definitions explains. This page walks through the app with the demo sources that ship with the framework.
Timeline
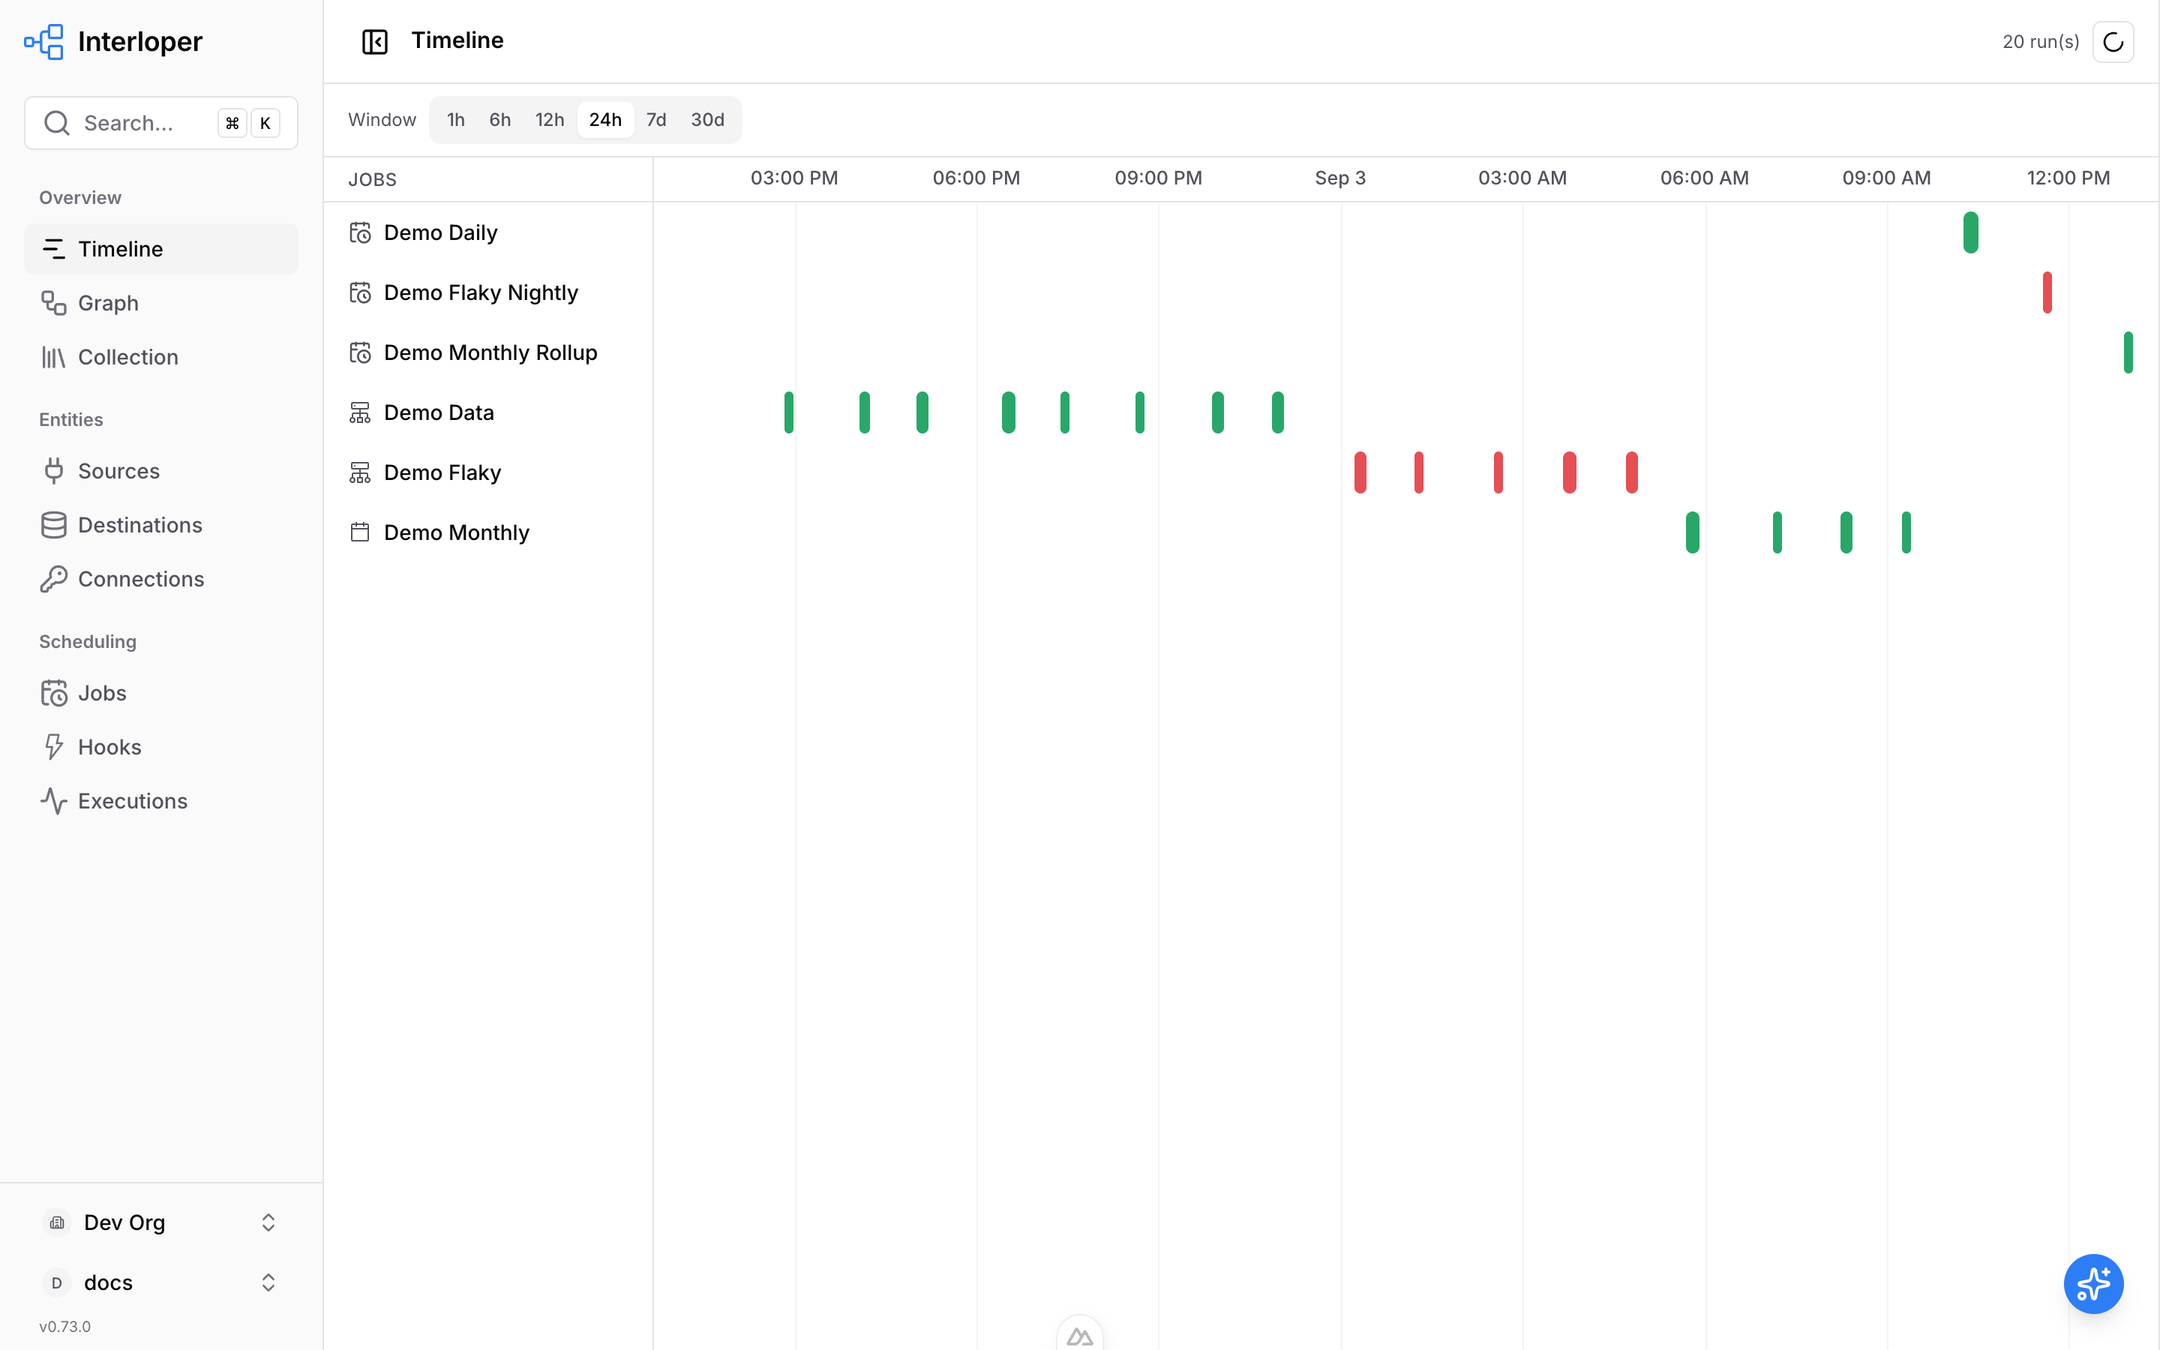
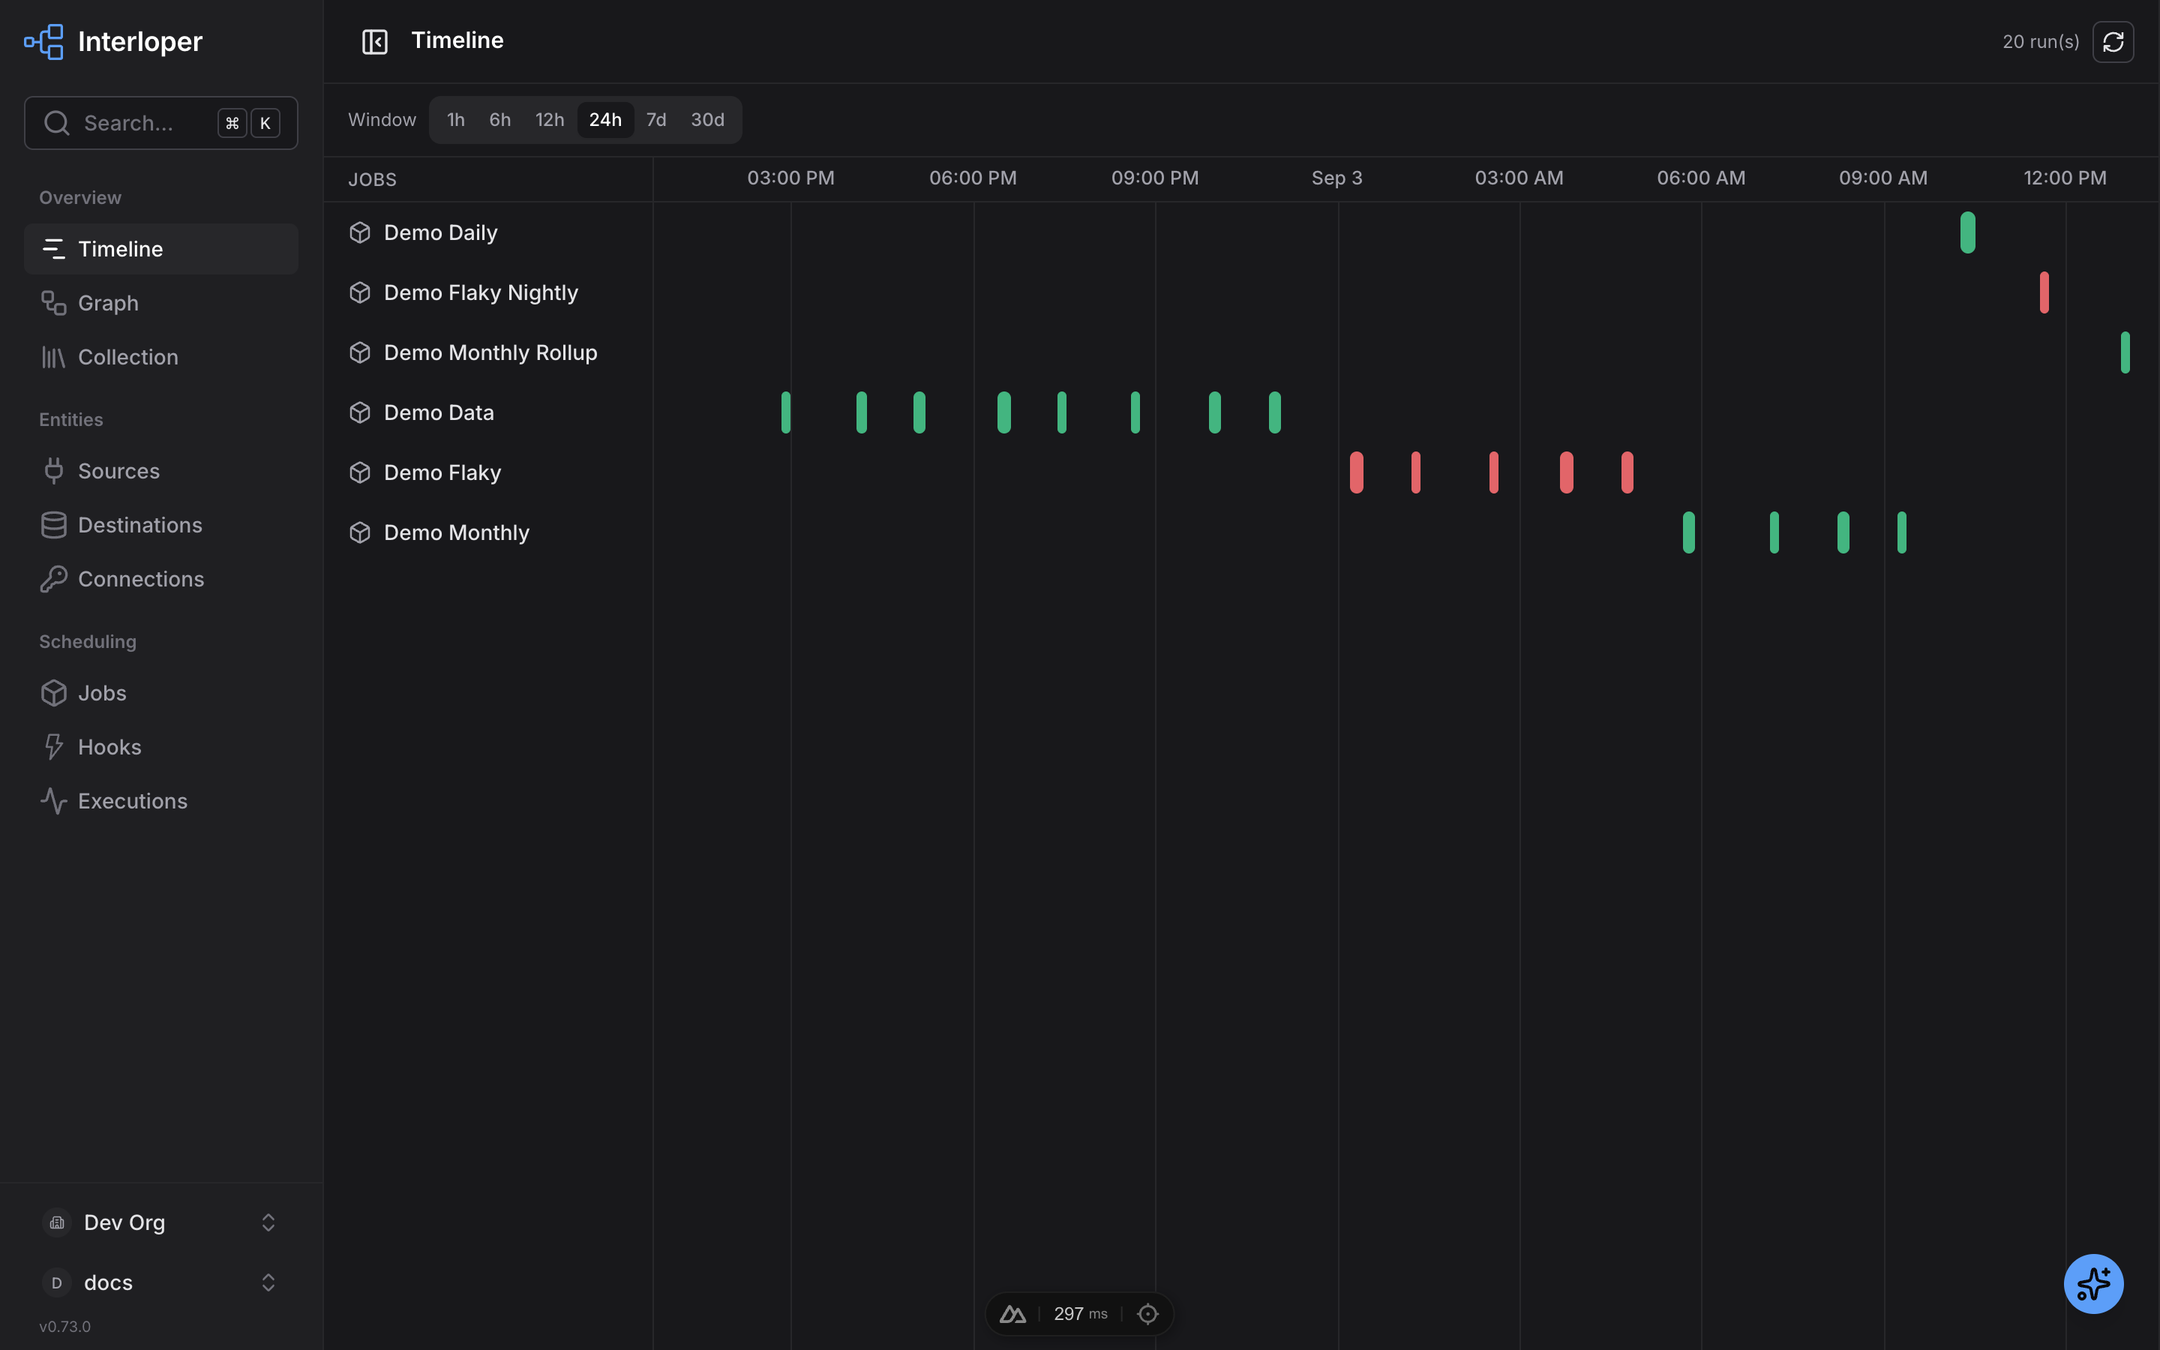
The landing page: one row per job and per source, one bar per run over a selectable window, green for success and red for failure. Hovering a bar shows the run; clicking opens it.
Graph
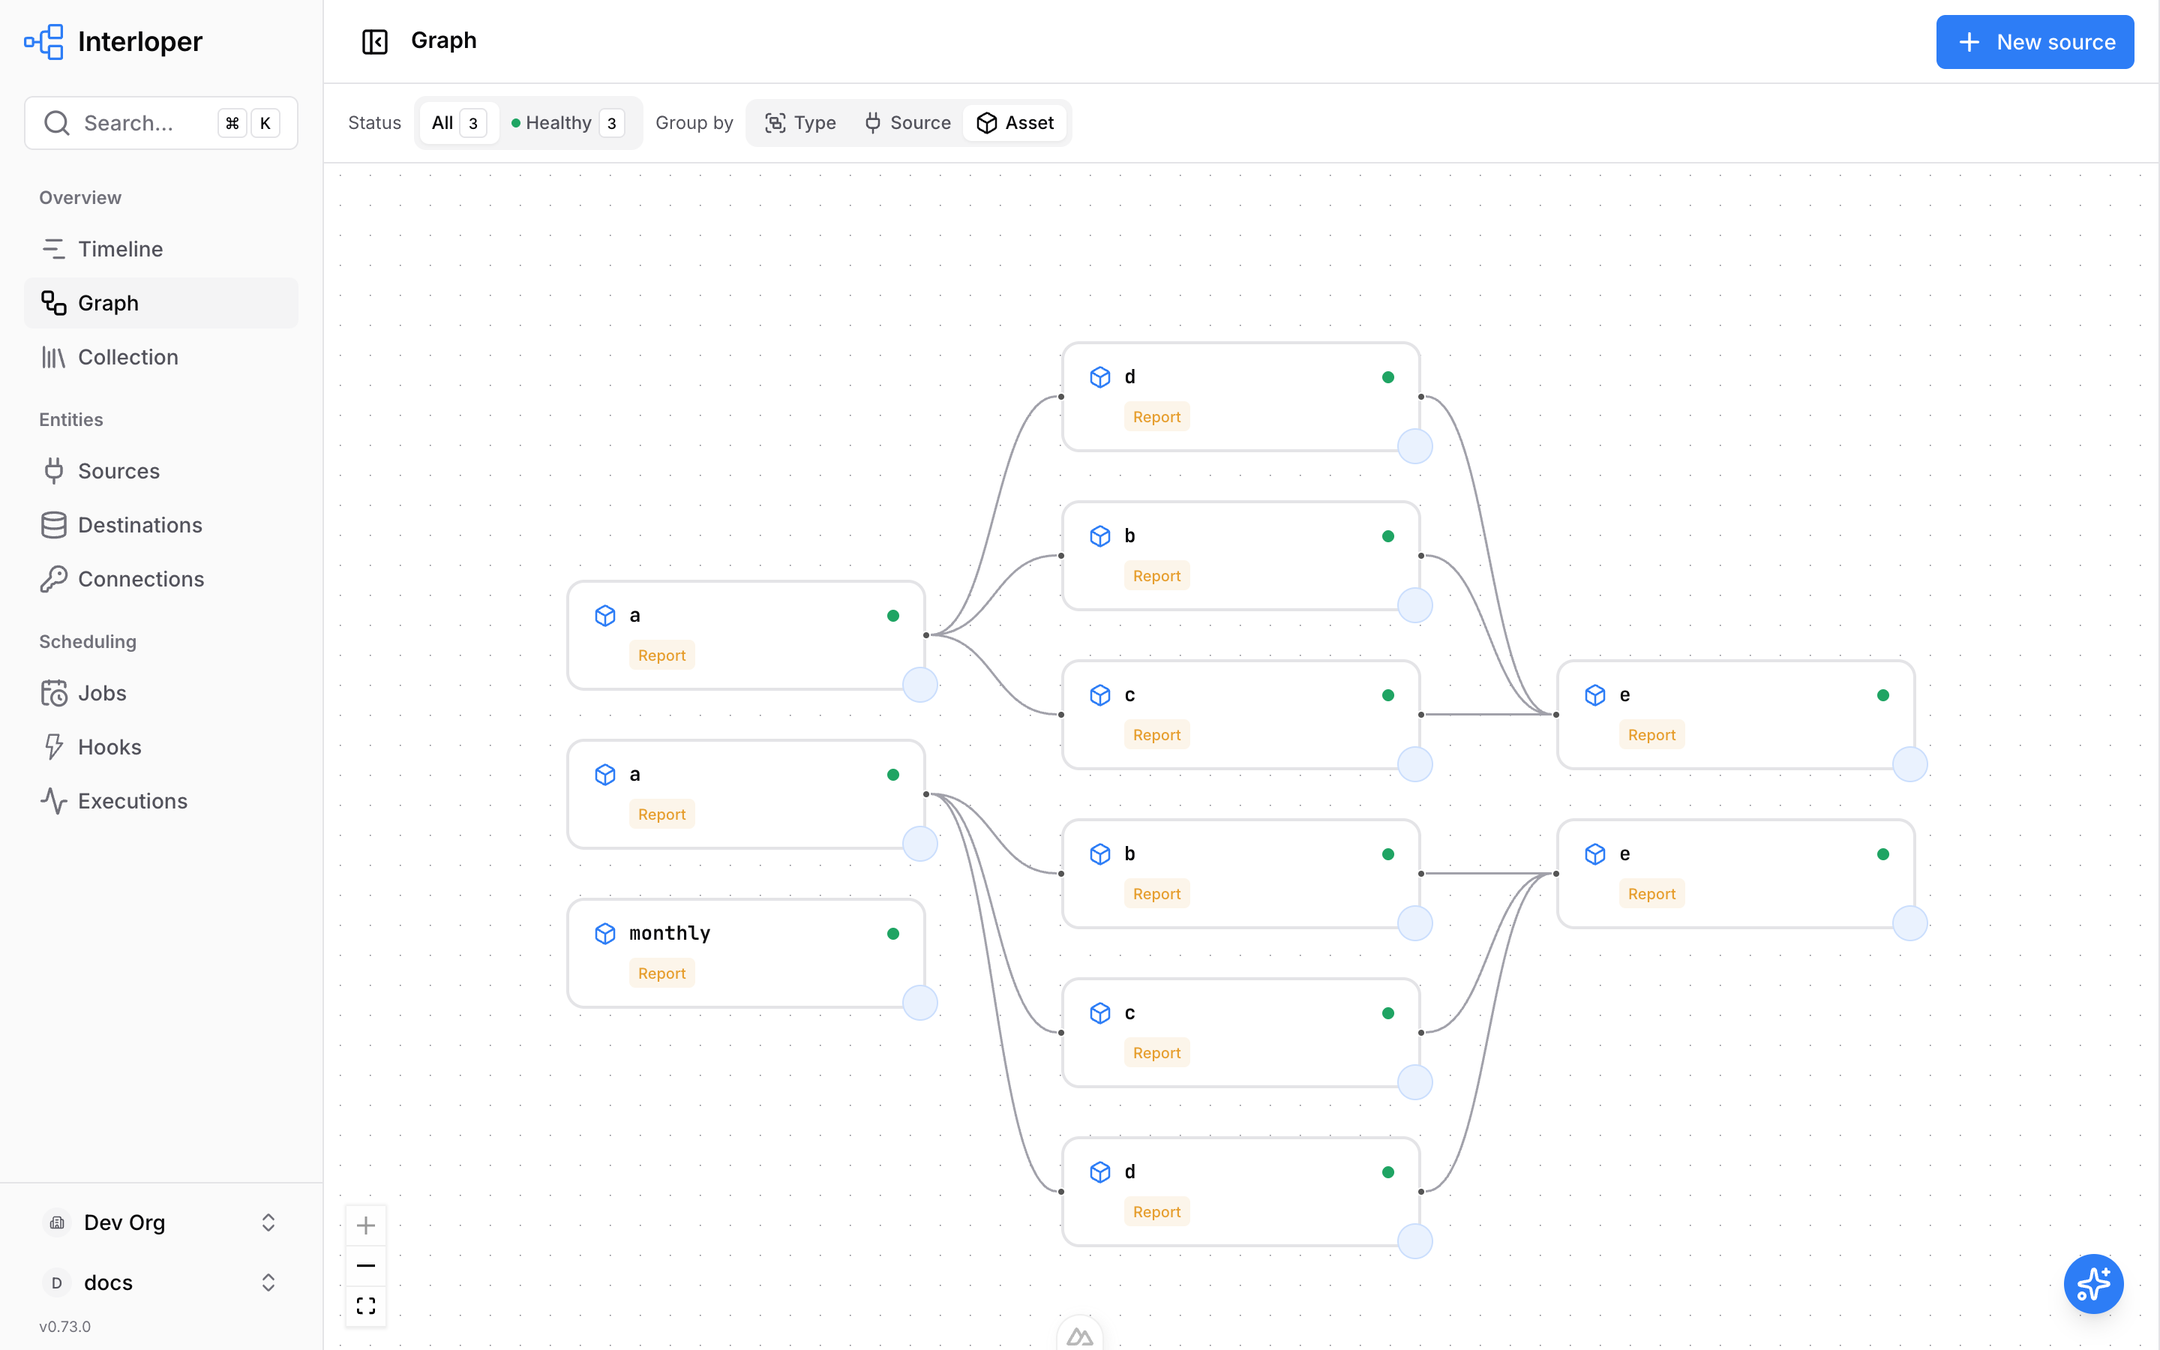
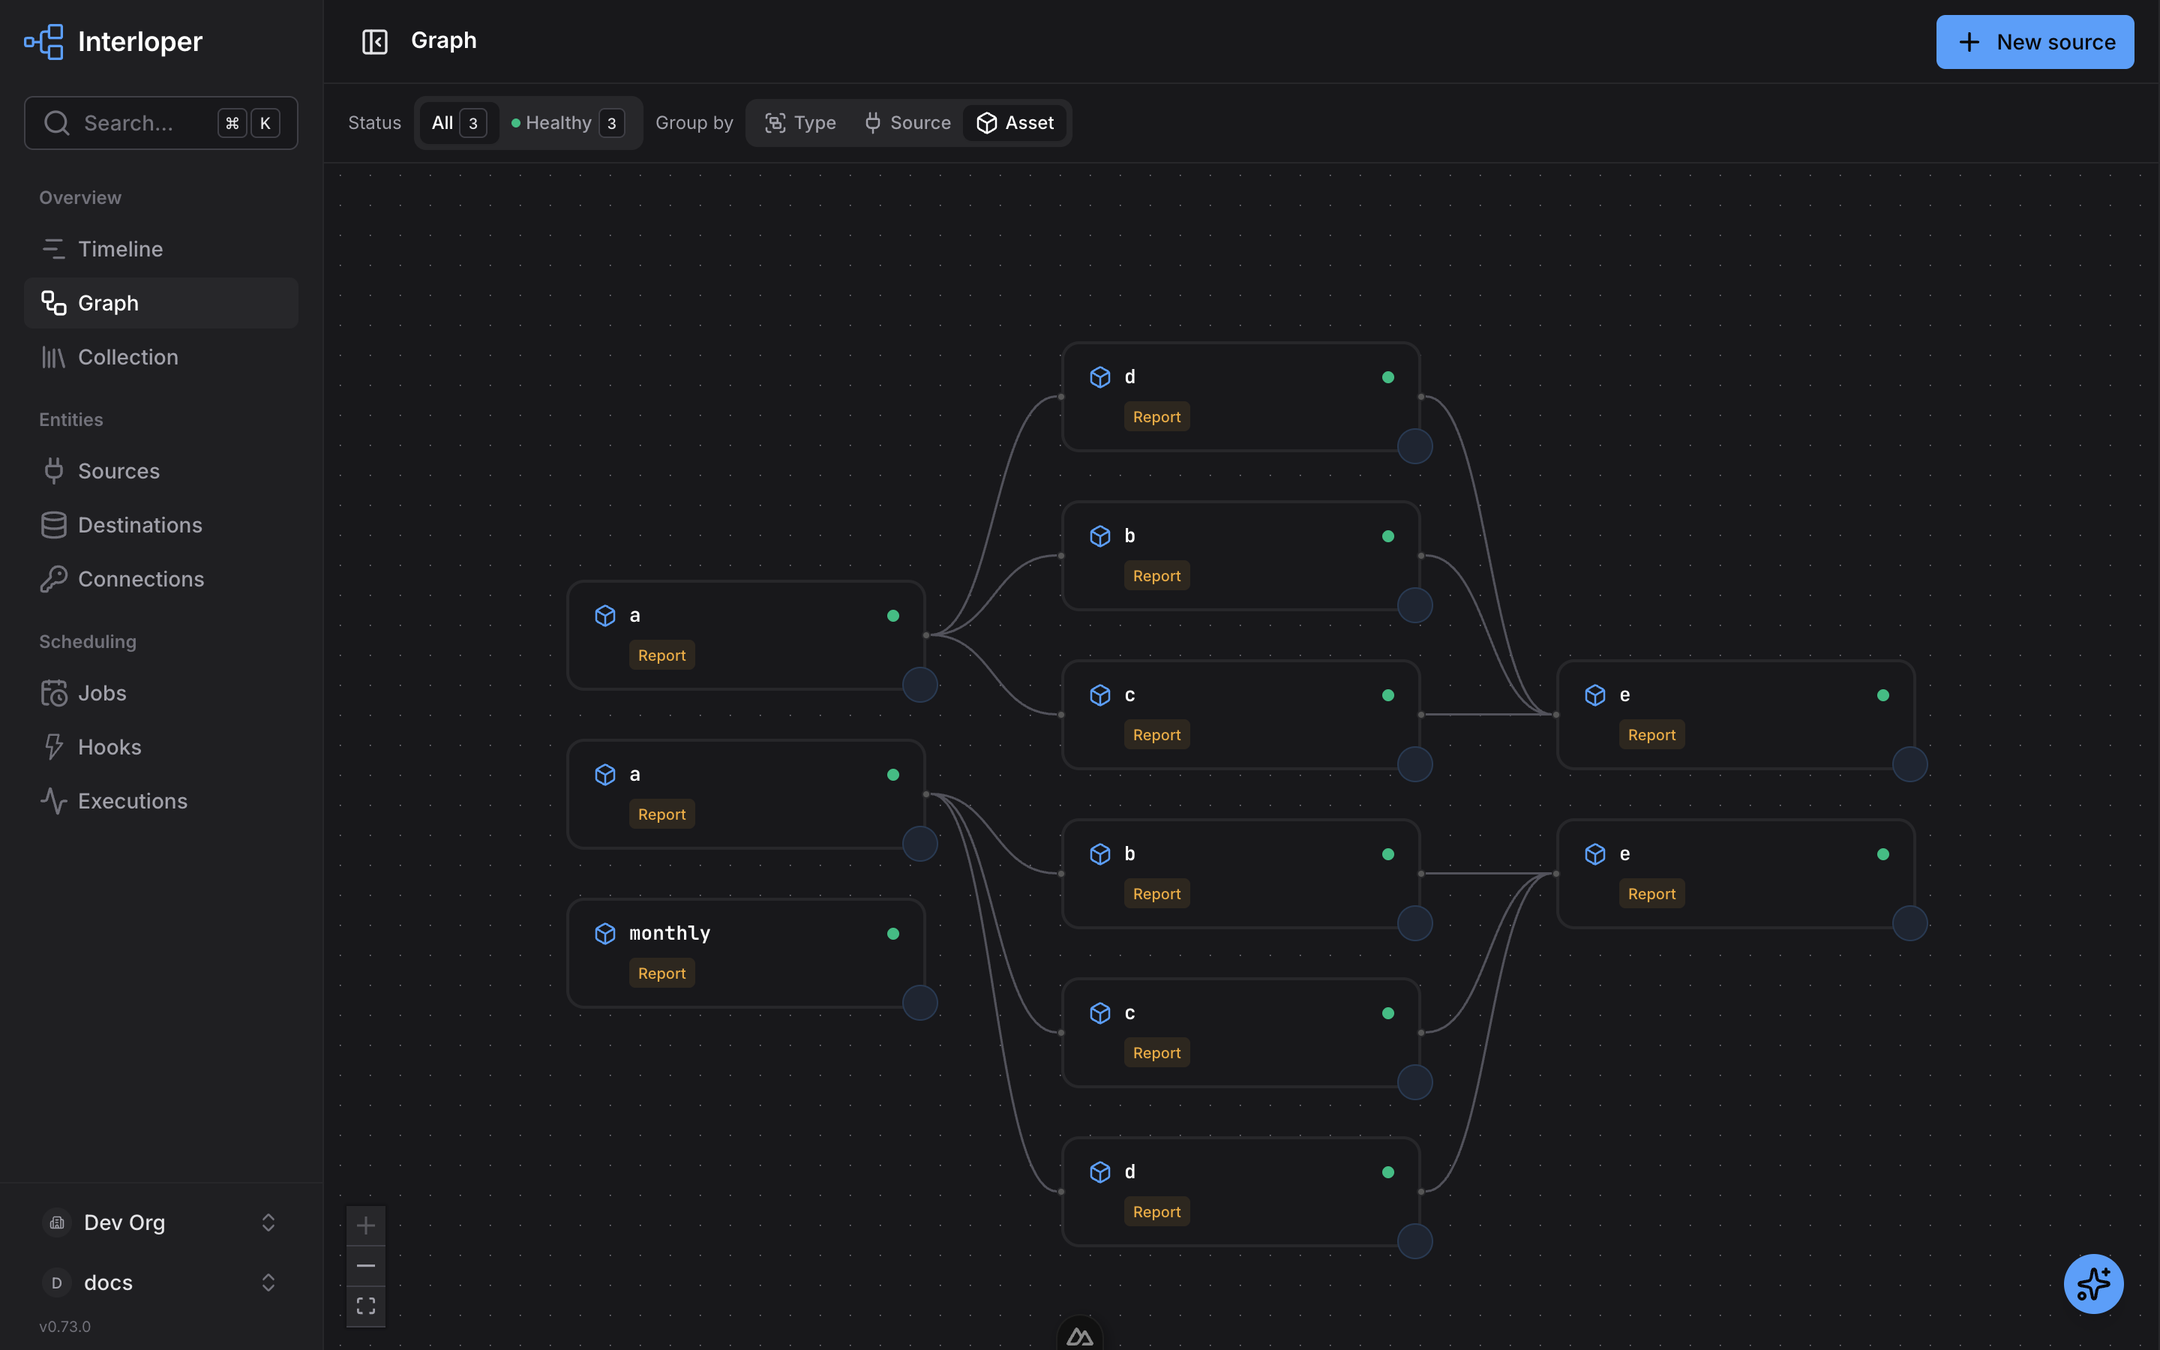
The lineage of every asset in the organisation, built from the dependency relations the
framework infers (a feeds b, c, d, which feed e). Nodes carry the asset's tags and its
health; the toolbar groups by asset, by source instance or by source type, and filters by status.
Selecting a node opens a panel with the asset's schema, partitioning, destinations and last runs.
Collection
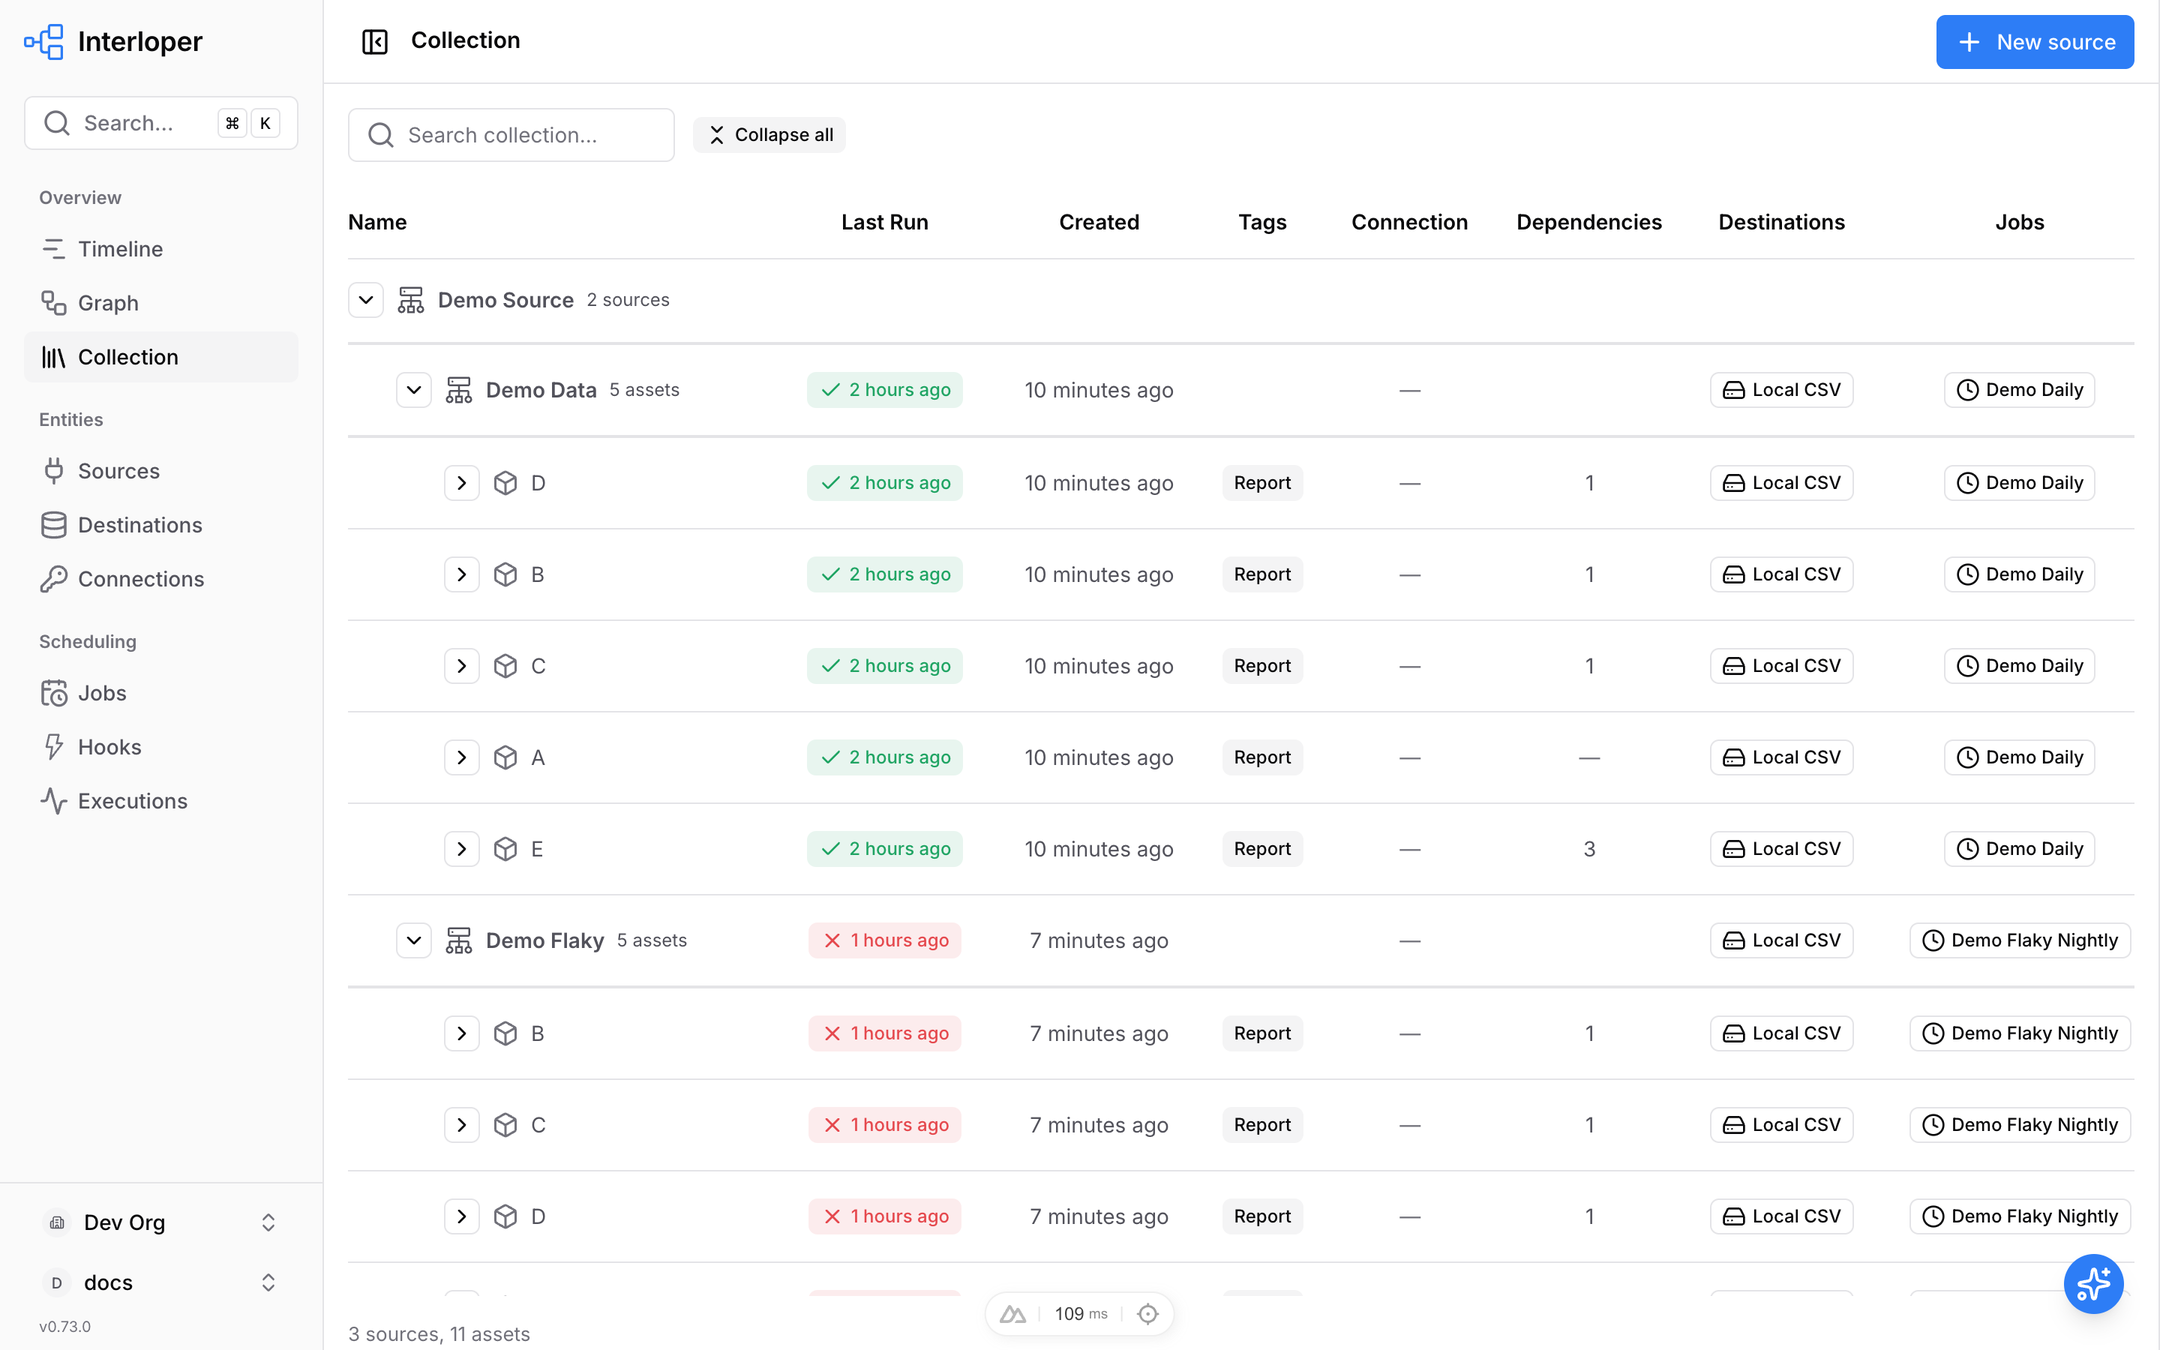
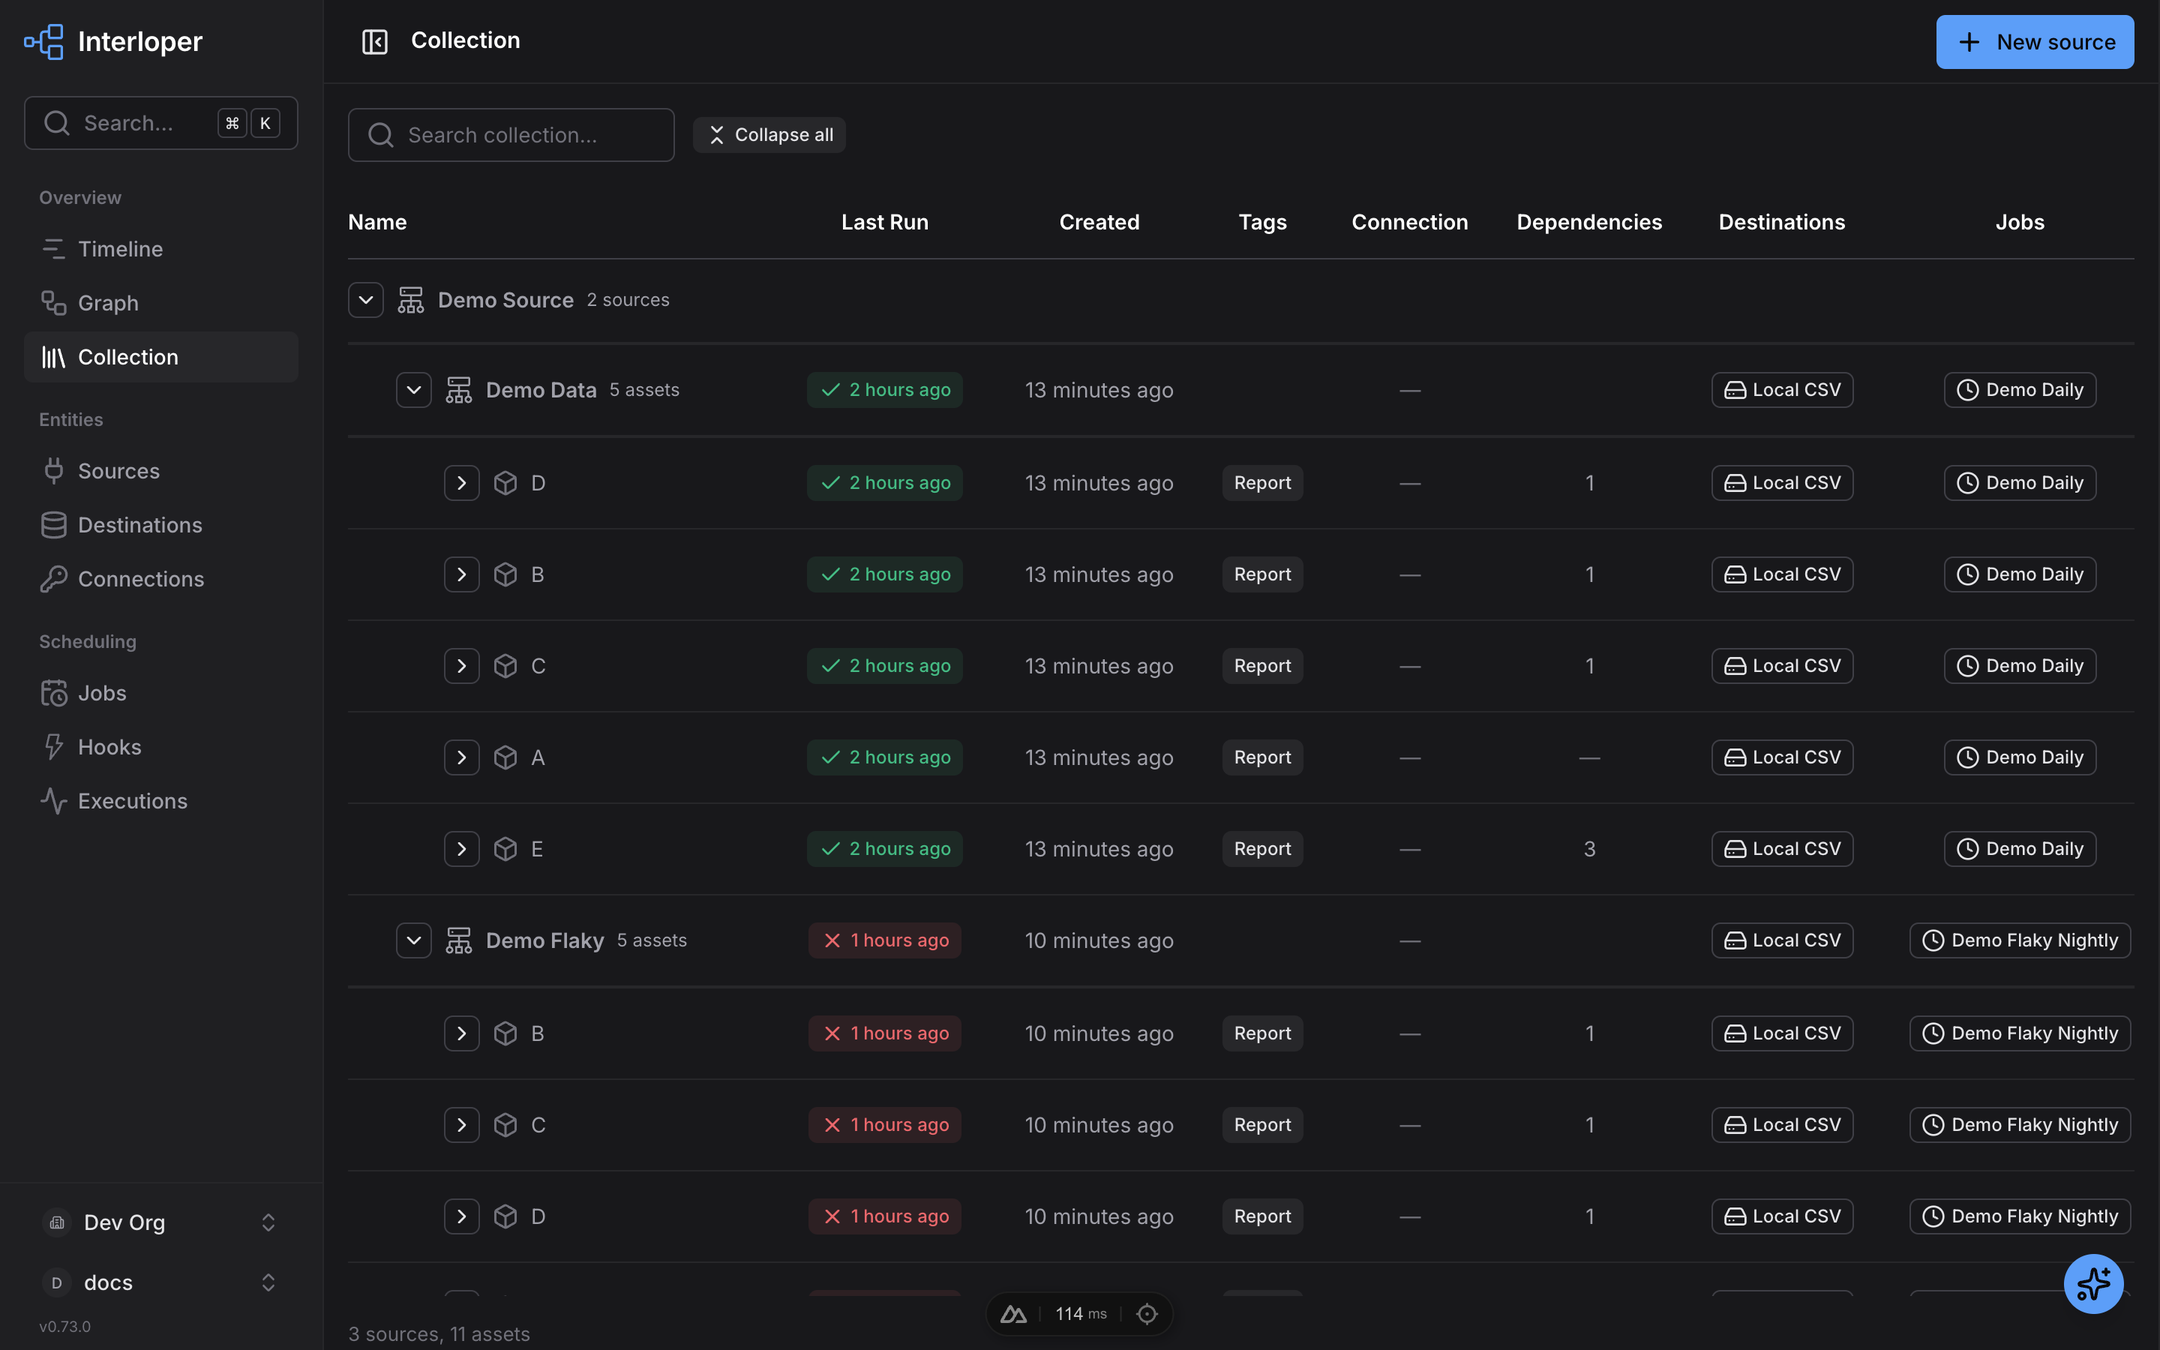
Every source instance and its assets, grouped by source type. Columns show the last run, the connection, the number of upstream dependencies, the destinations and the jobs that target each asset. The catalog of installed but not yet configured types is reachable from the "New source" button.
Sources
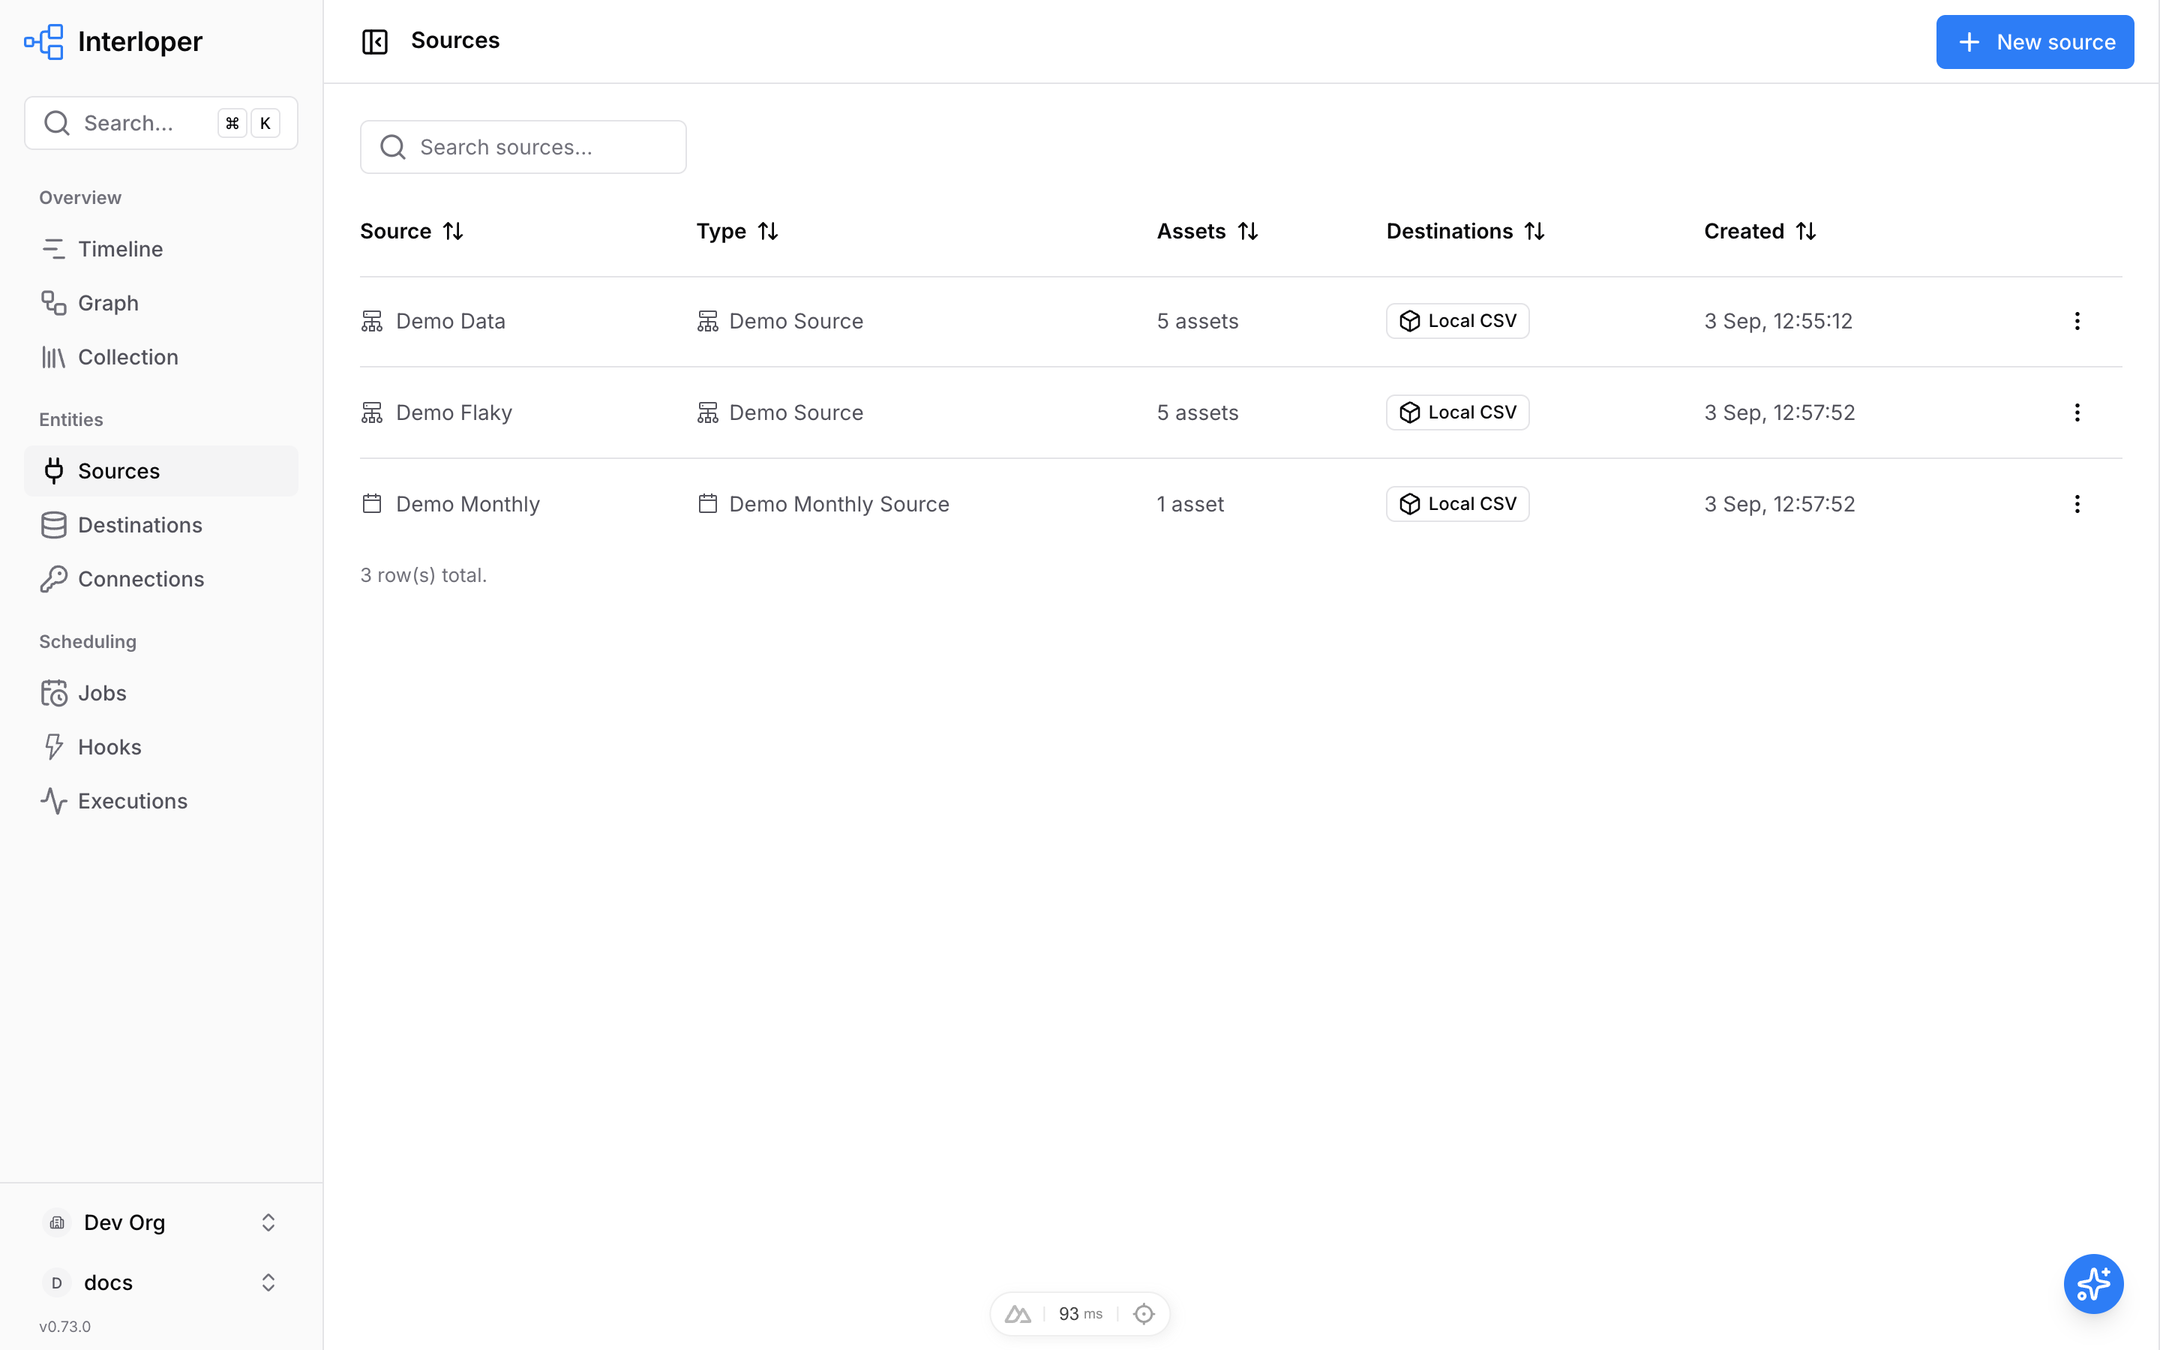
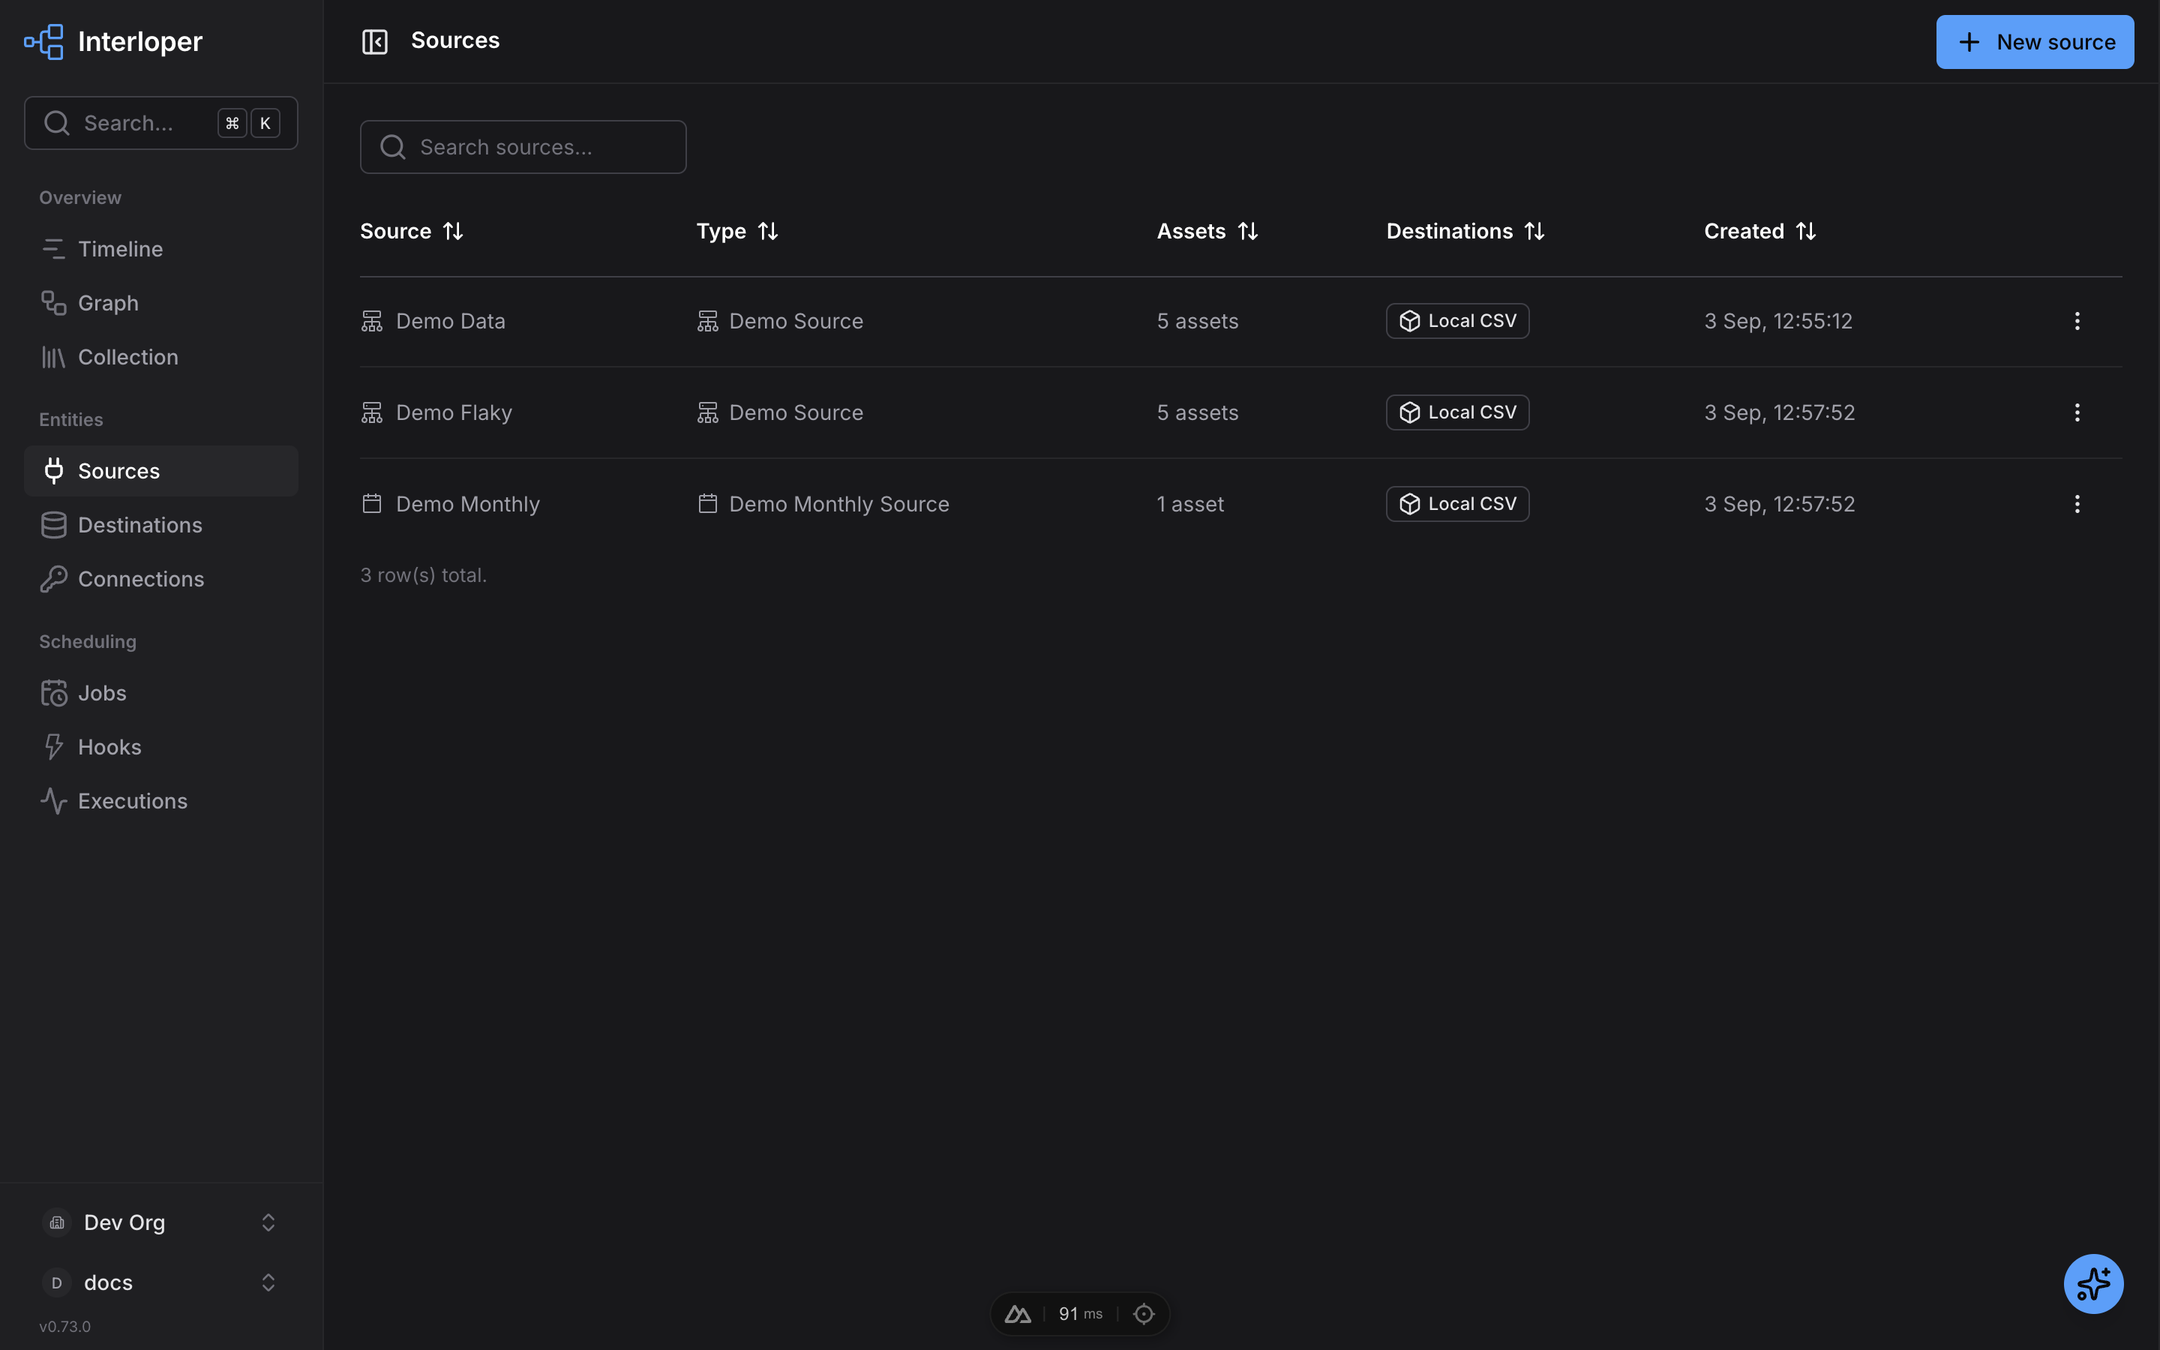
The configured source instances. Two instances of the same type ("Demo Data" and "Demo Flaky") coexist because each has its own dataset; with a discriminator field they would also have distinct table names.
Creating a source
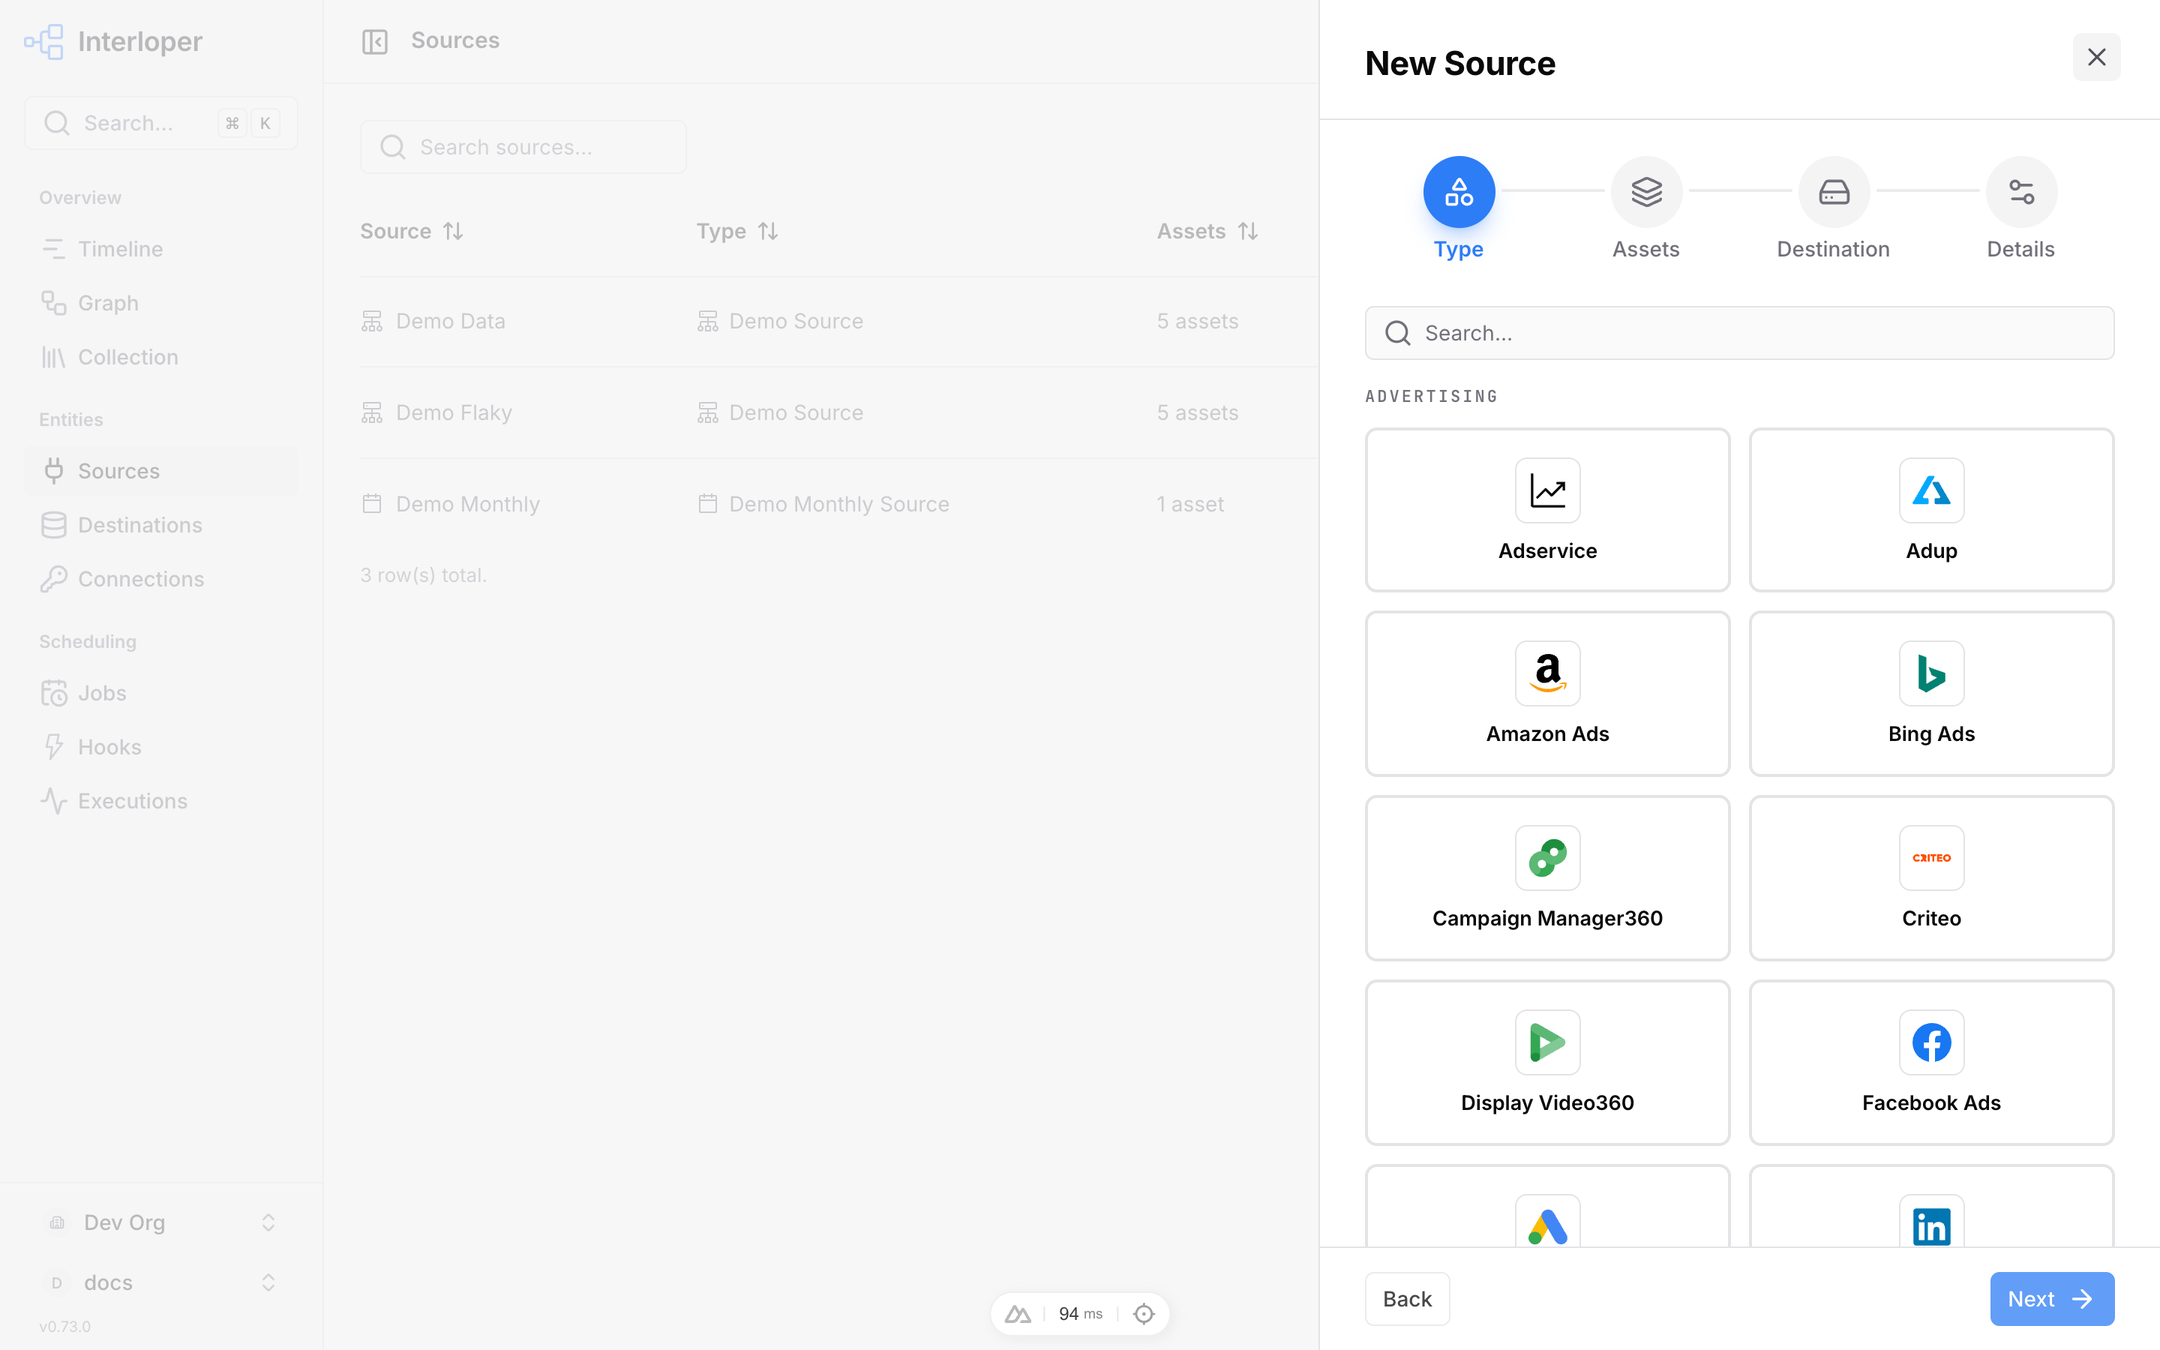
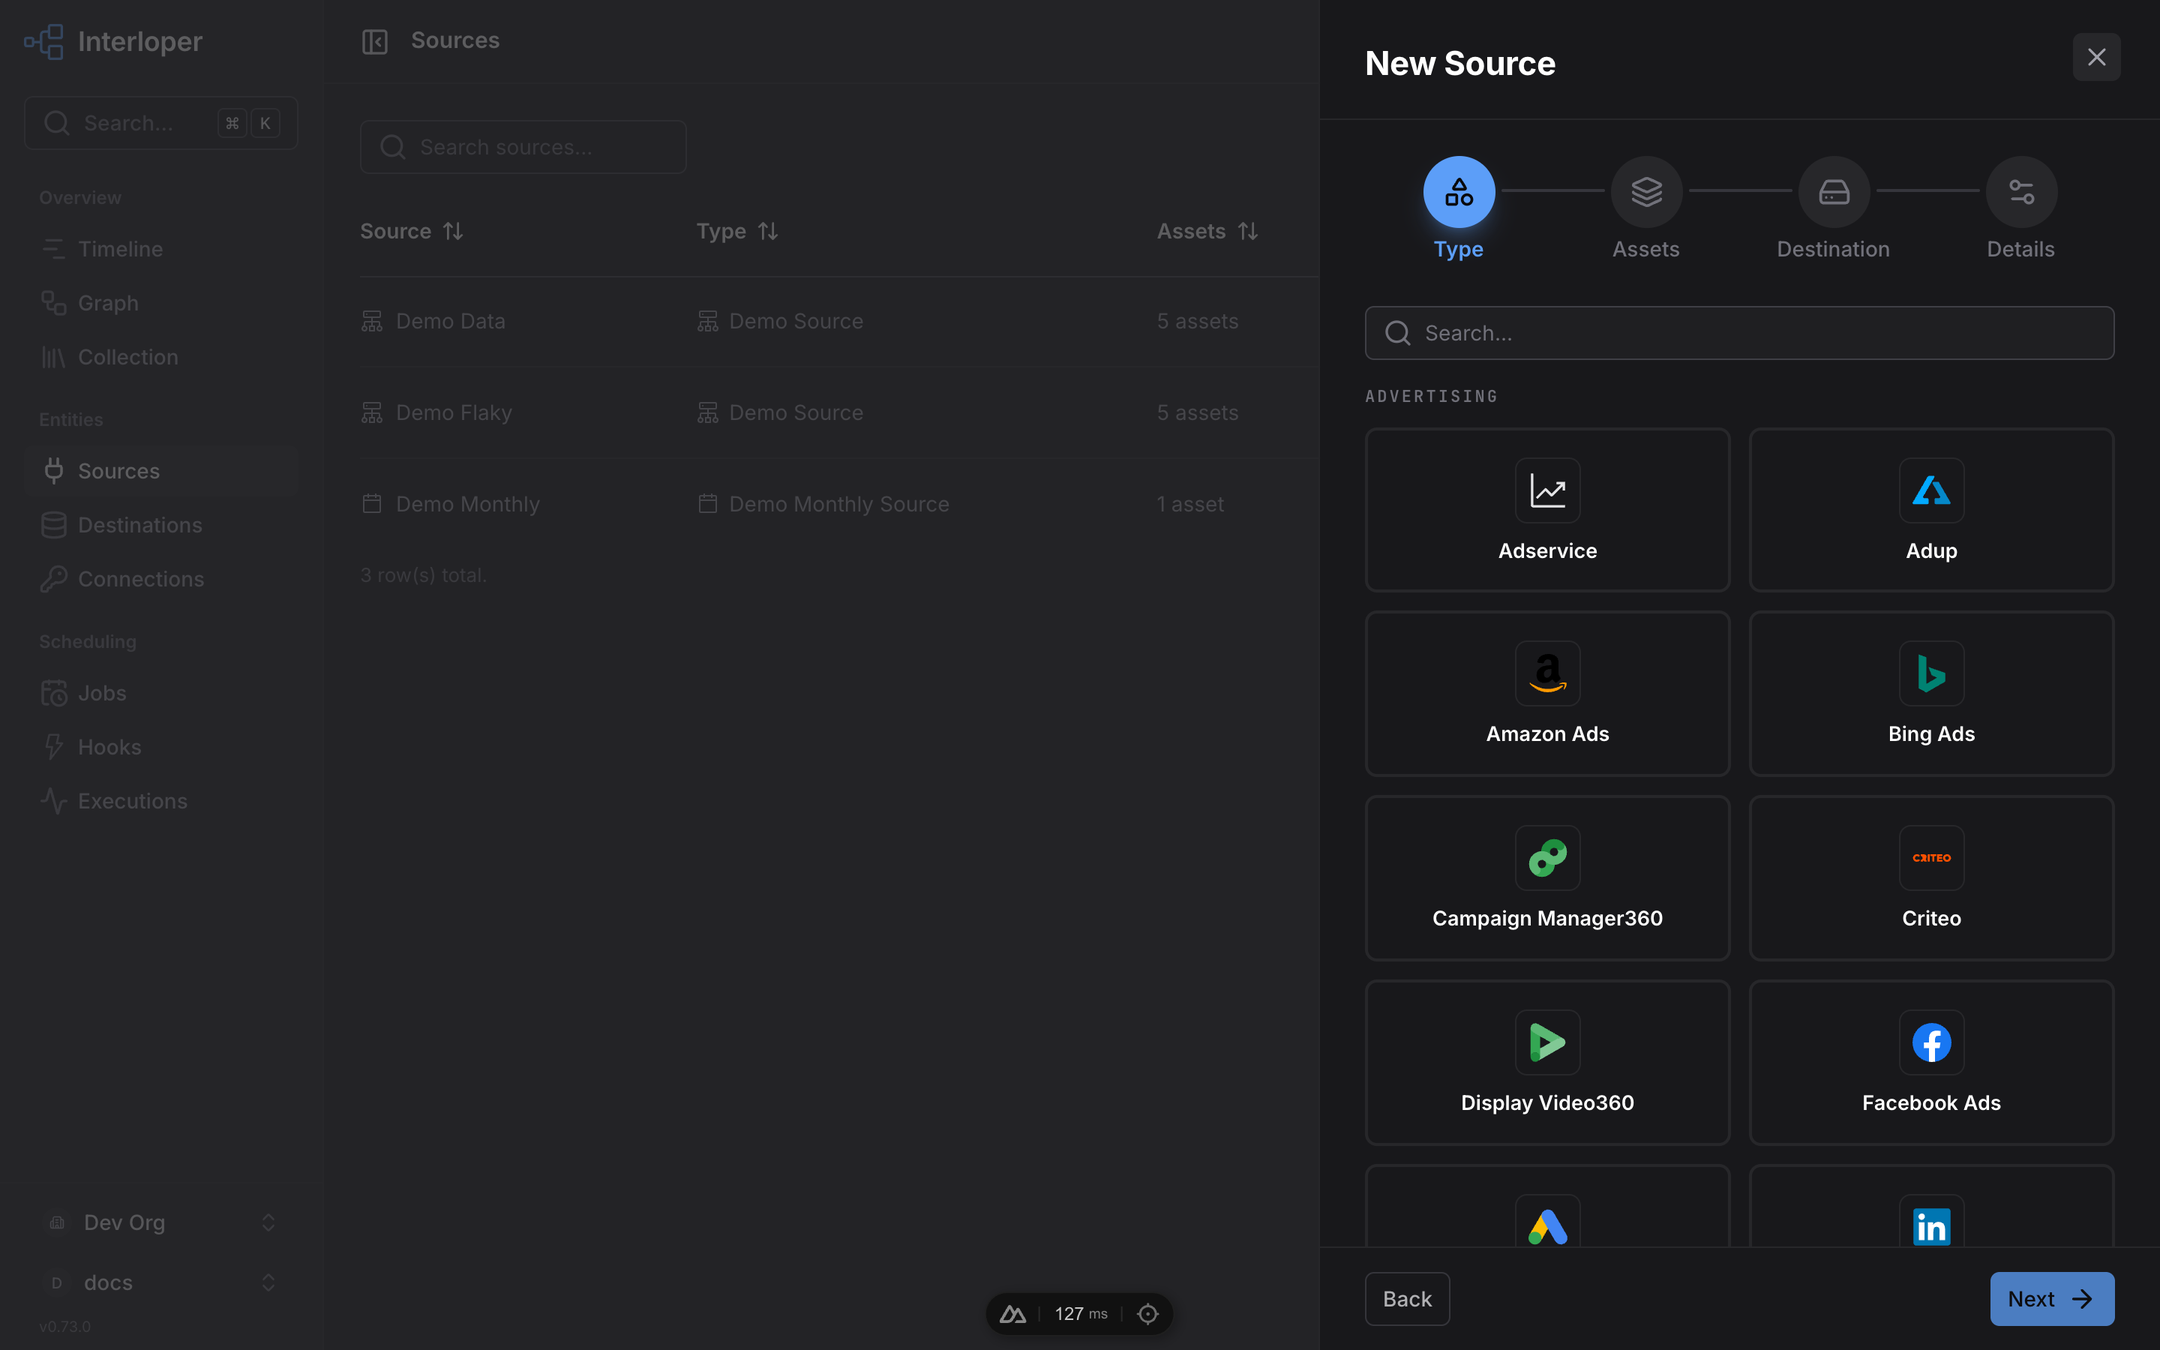
The wizard opens on the type step: one tile per source definition in the catalog, grouped by tag, with the icon and name the class declares. Selecting a tile advances.
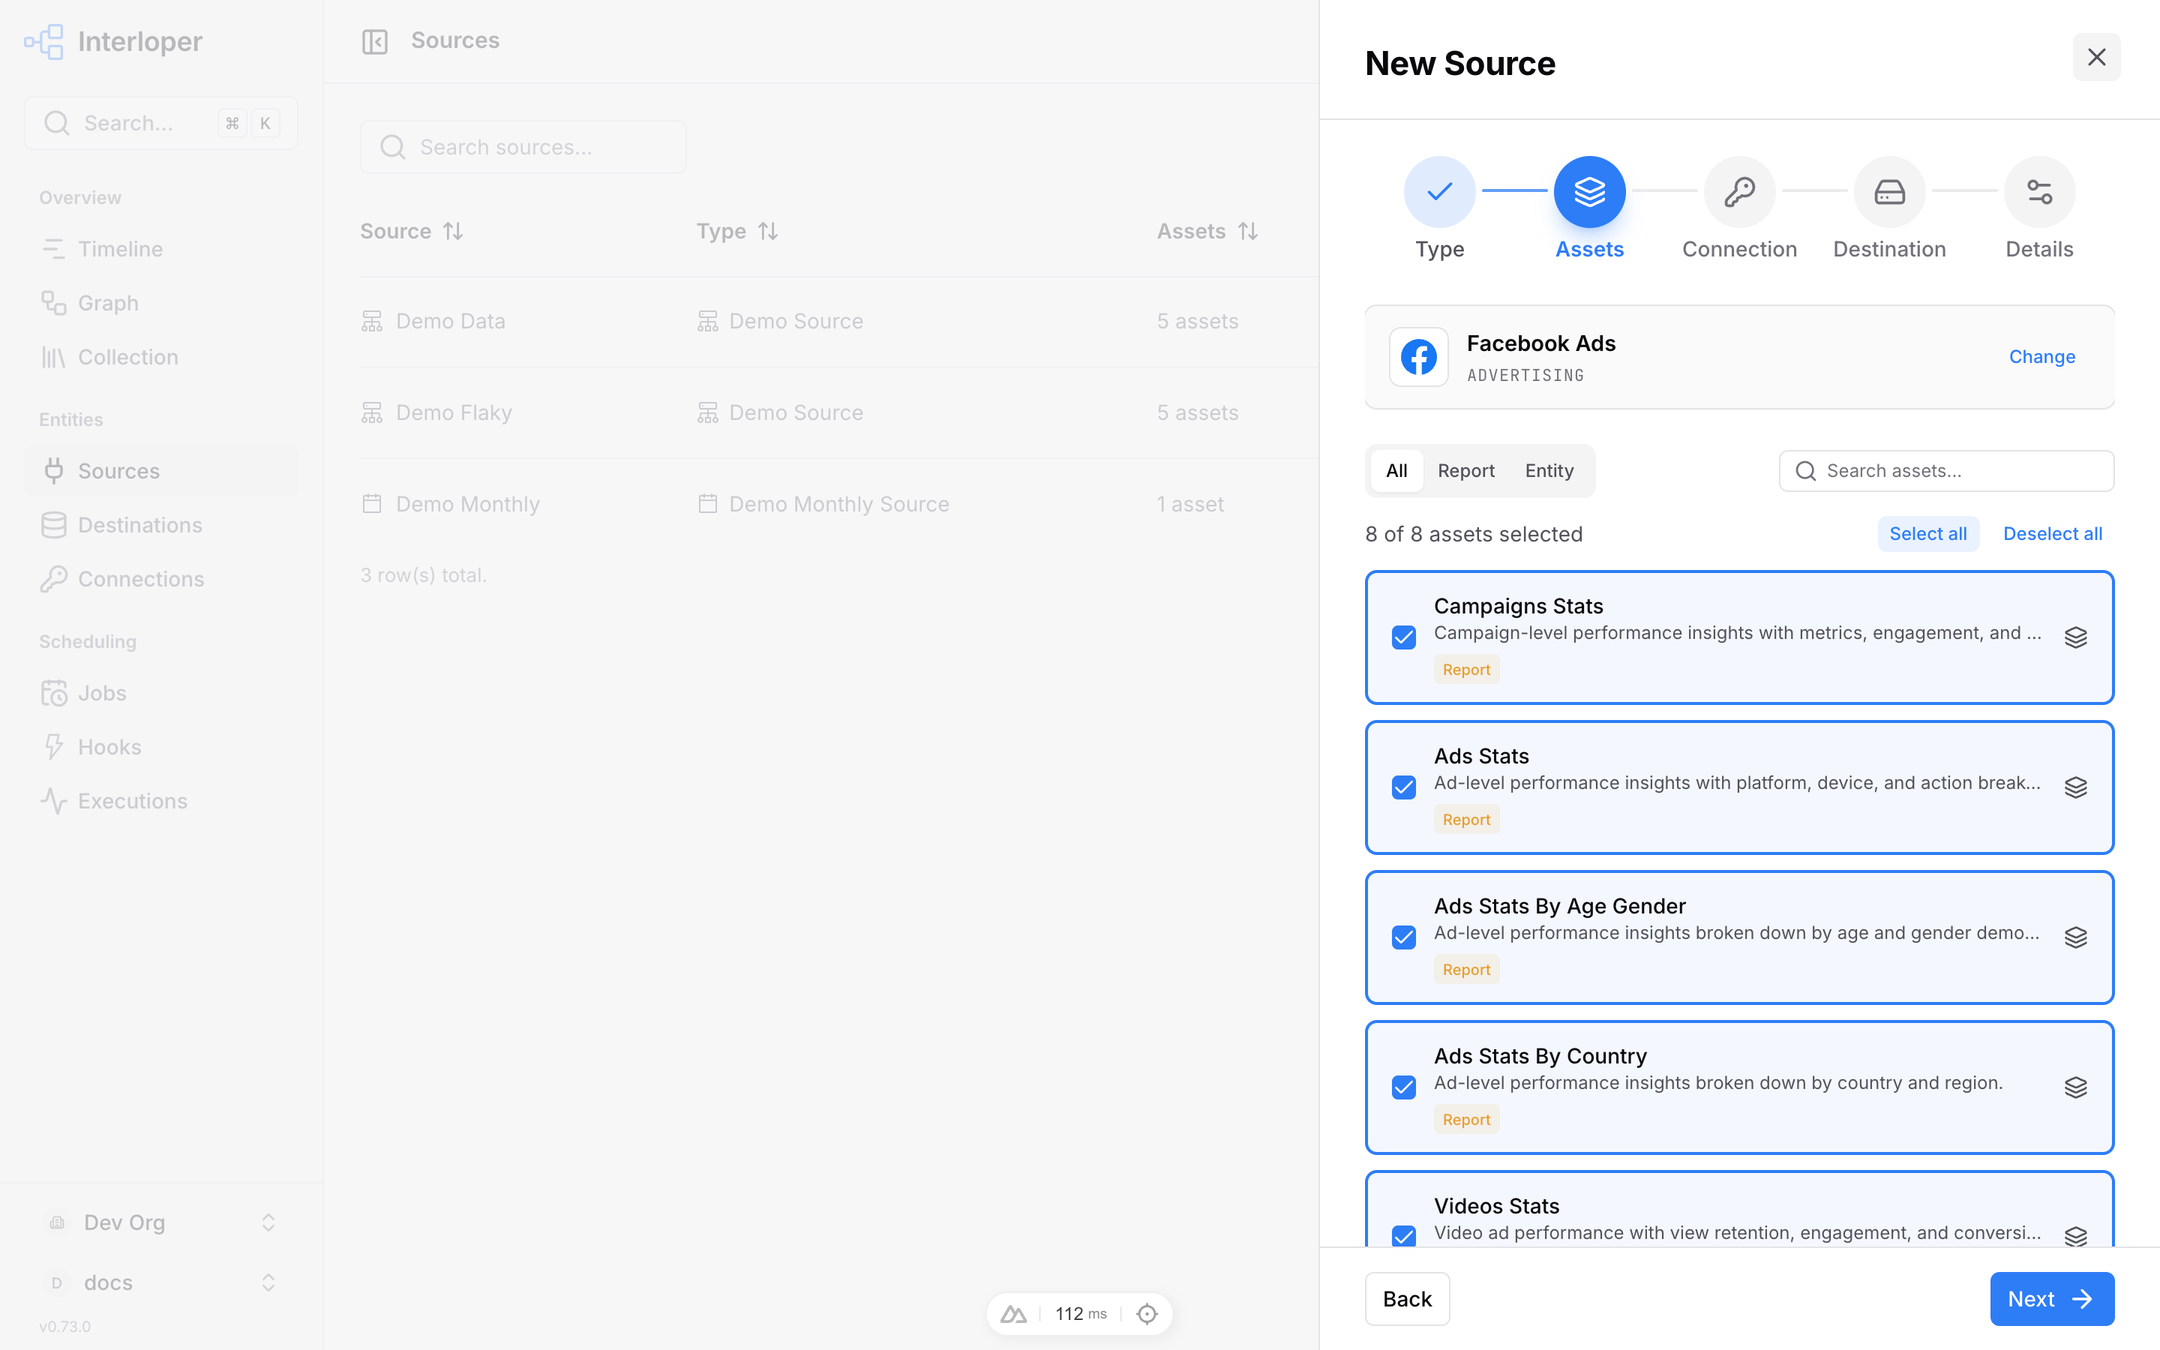
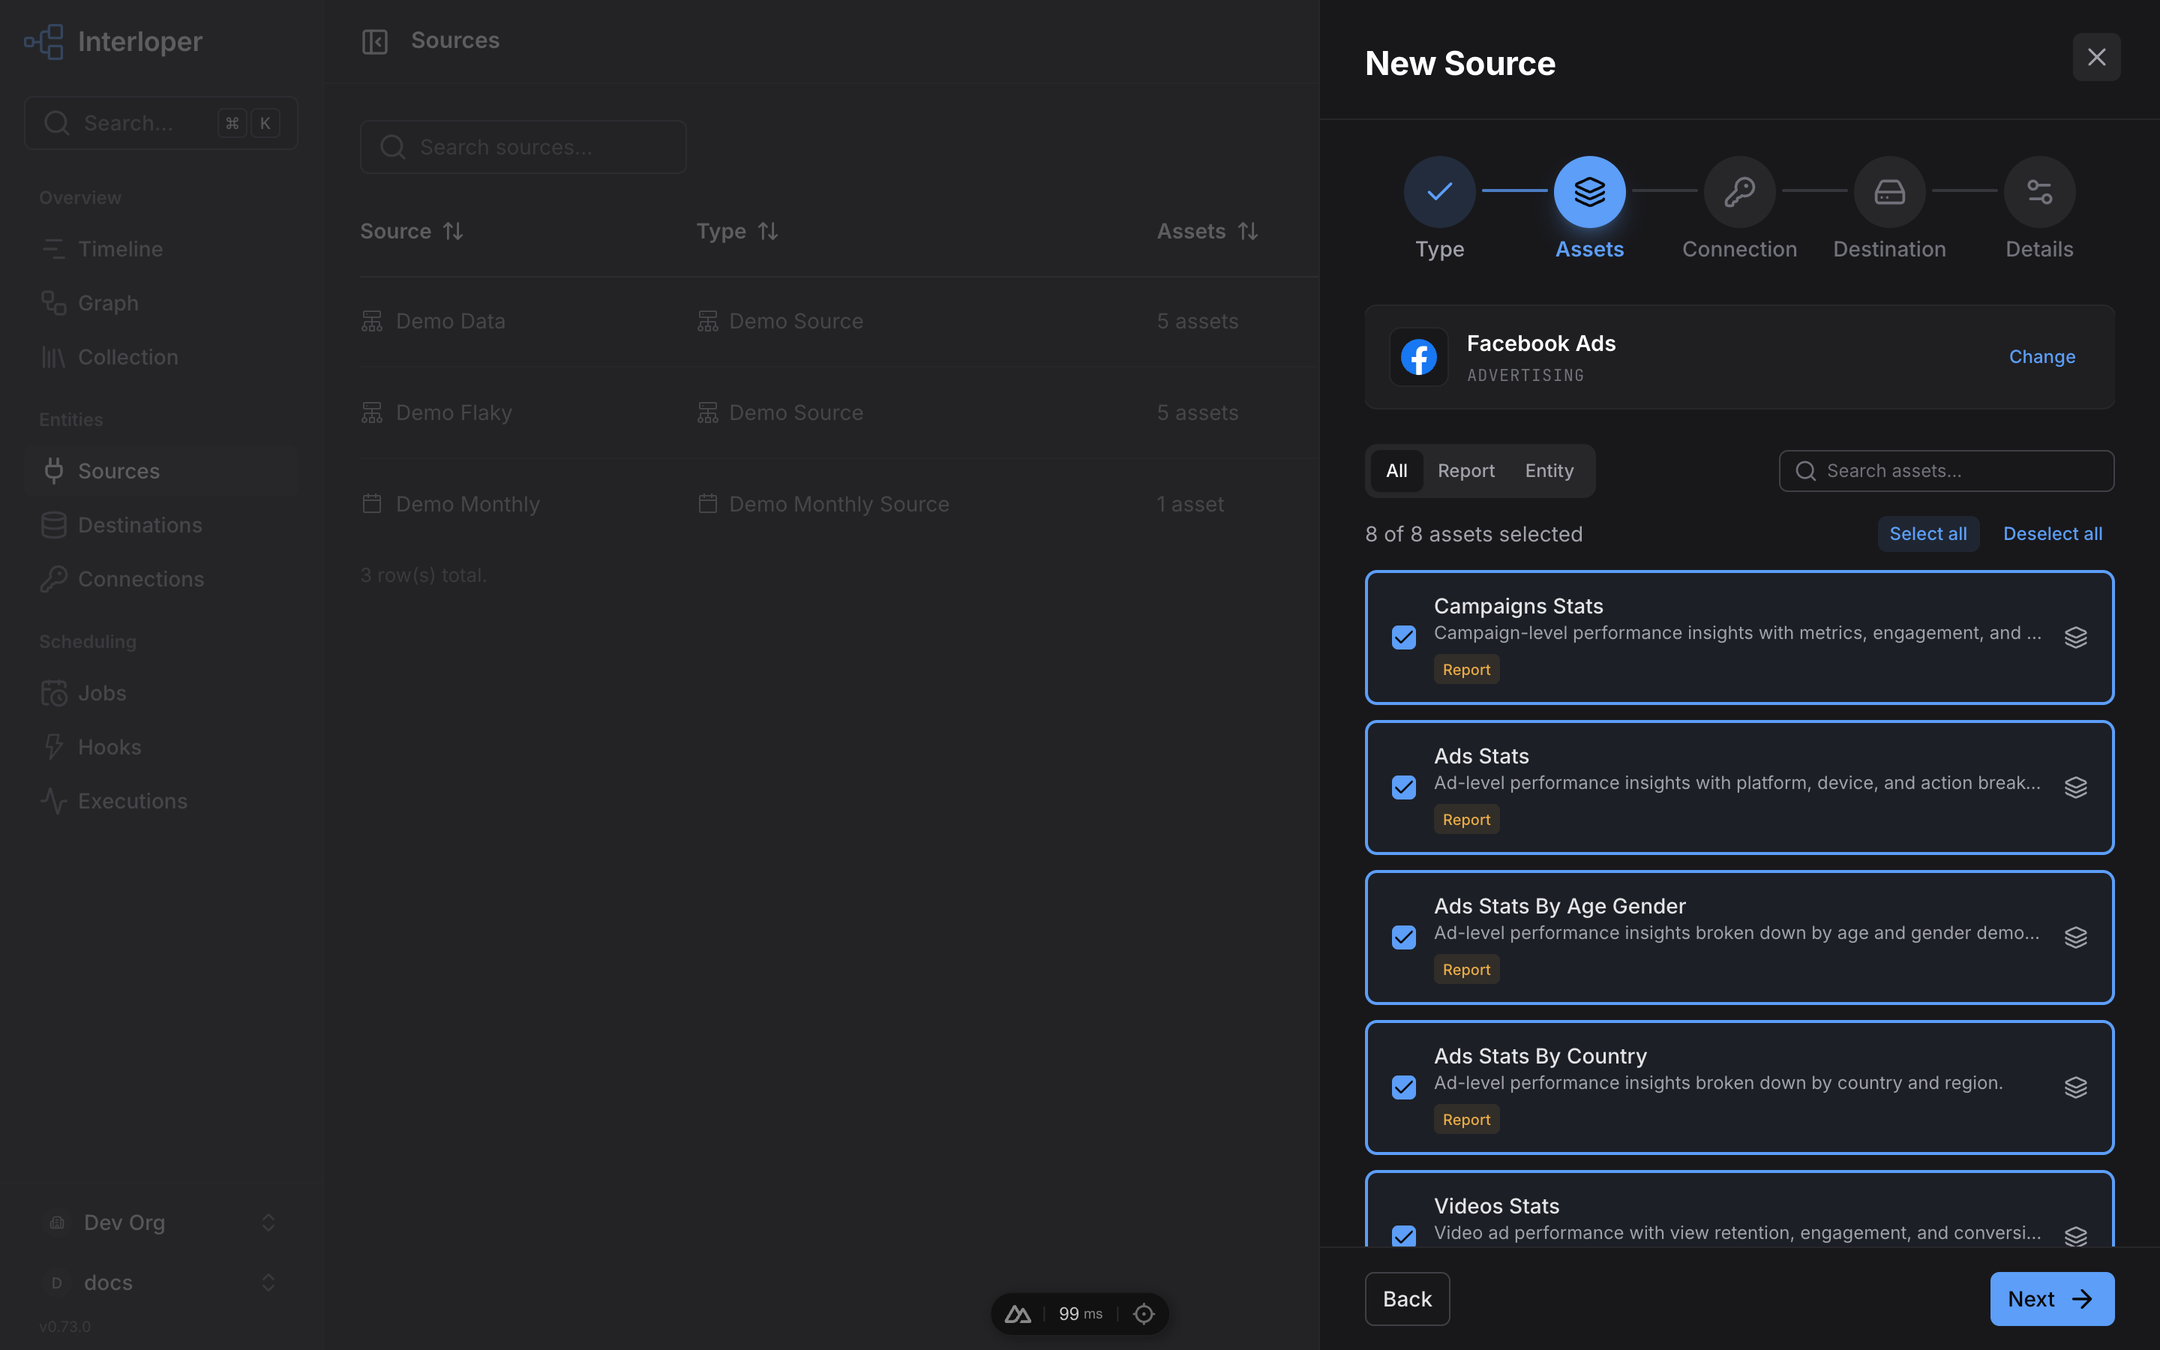
The assets step lists the definition's assets with their docstrings and tags, filterable by tag. The selection becomes the source's children; assets left out stay available as dependencies.
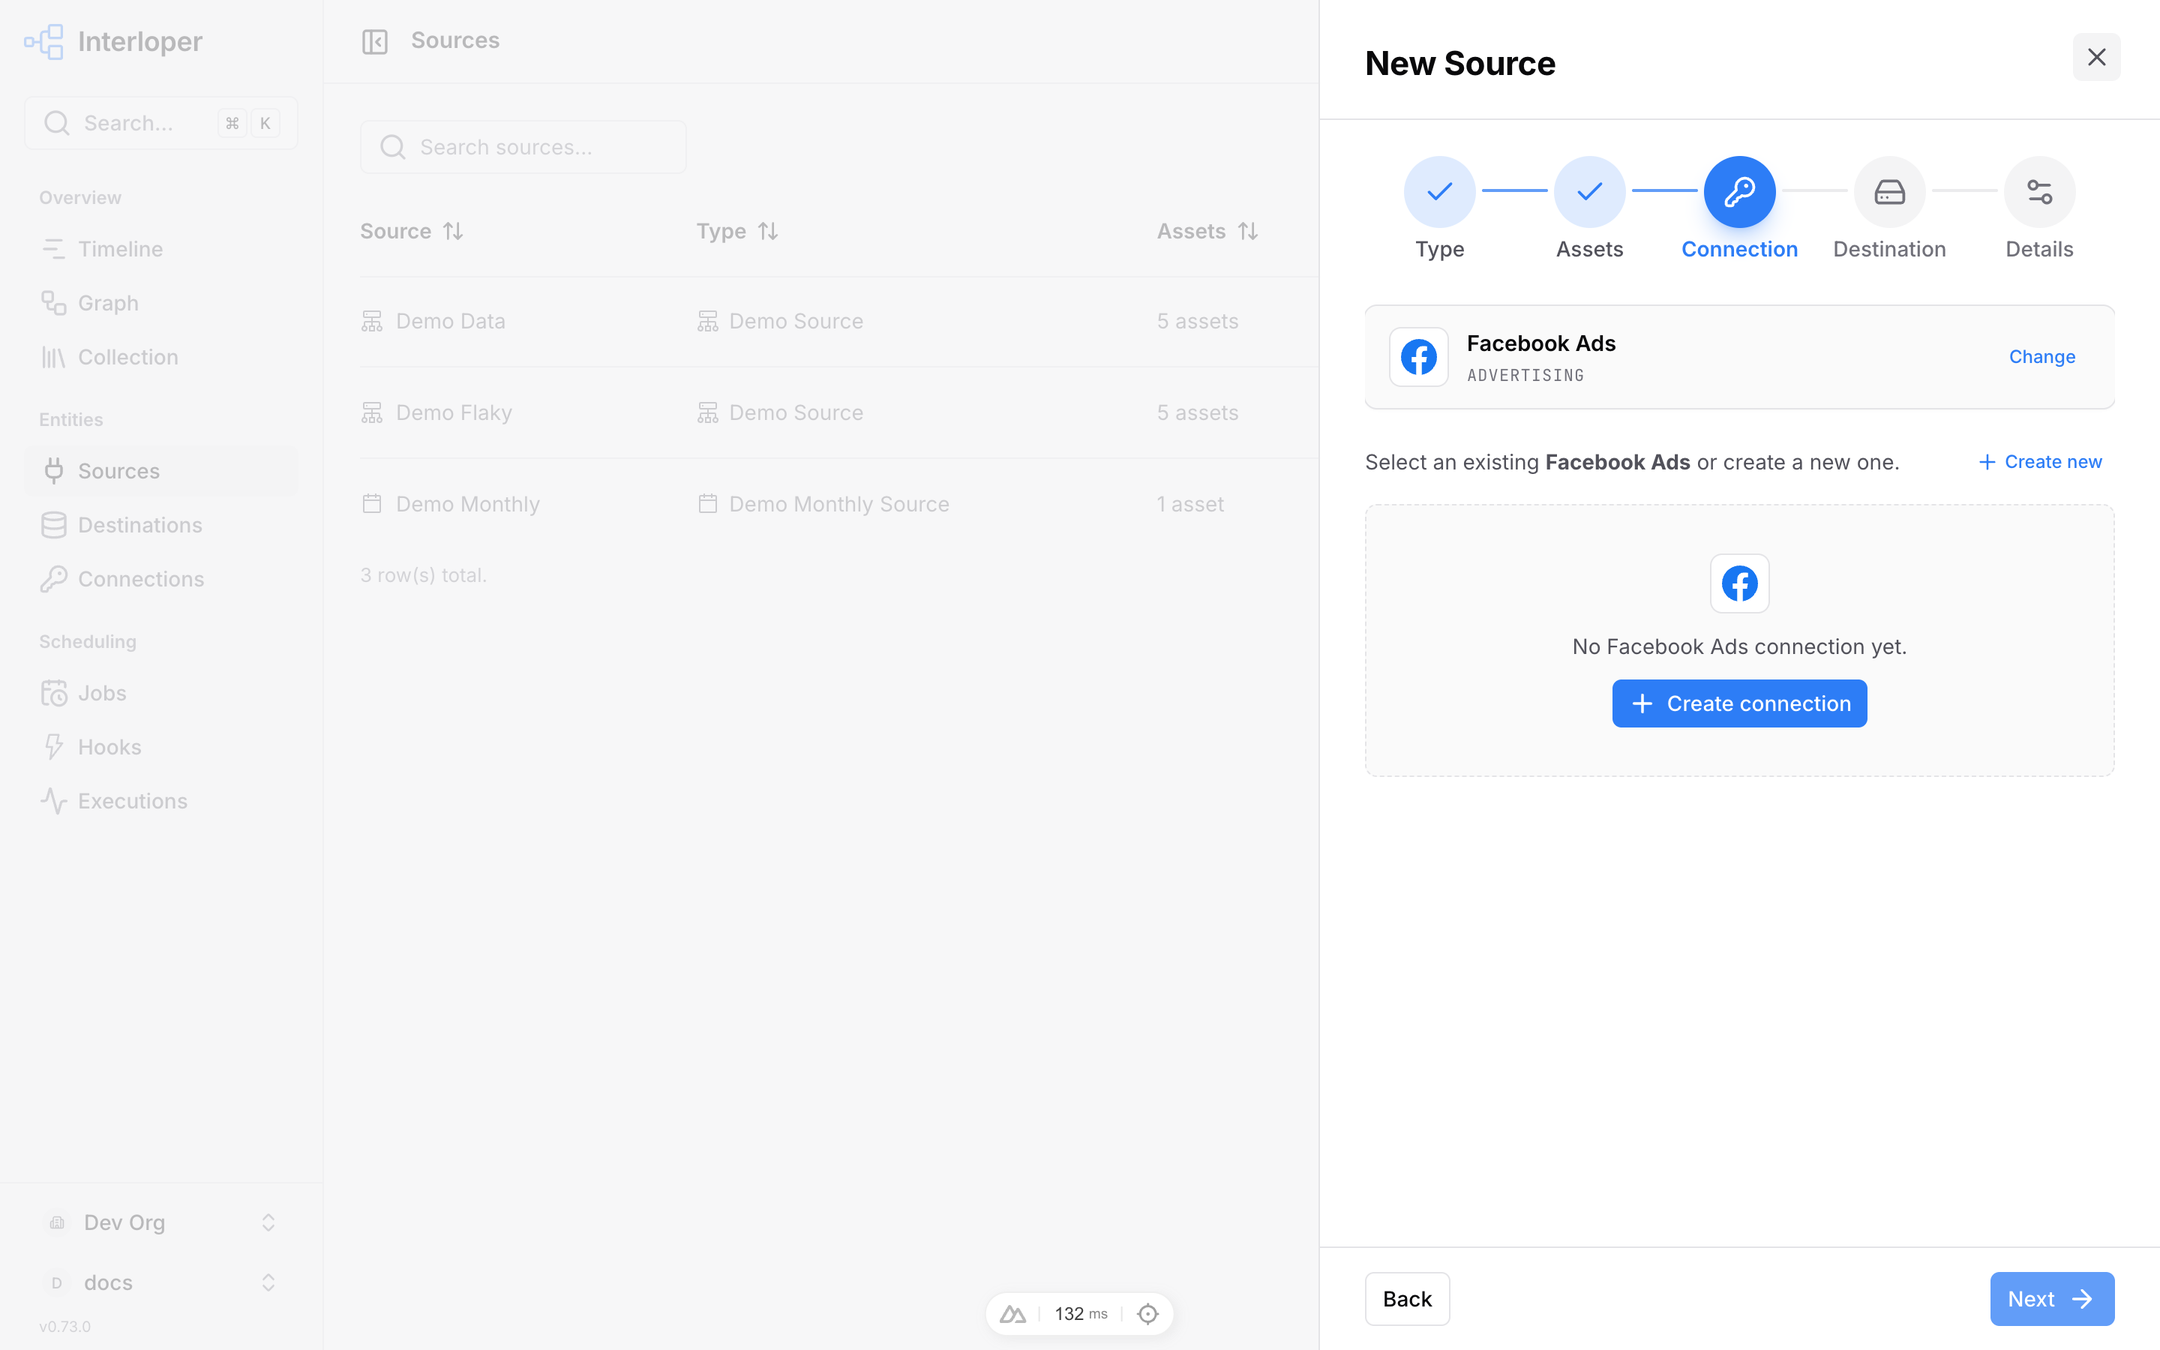
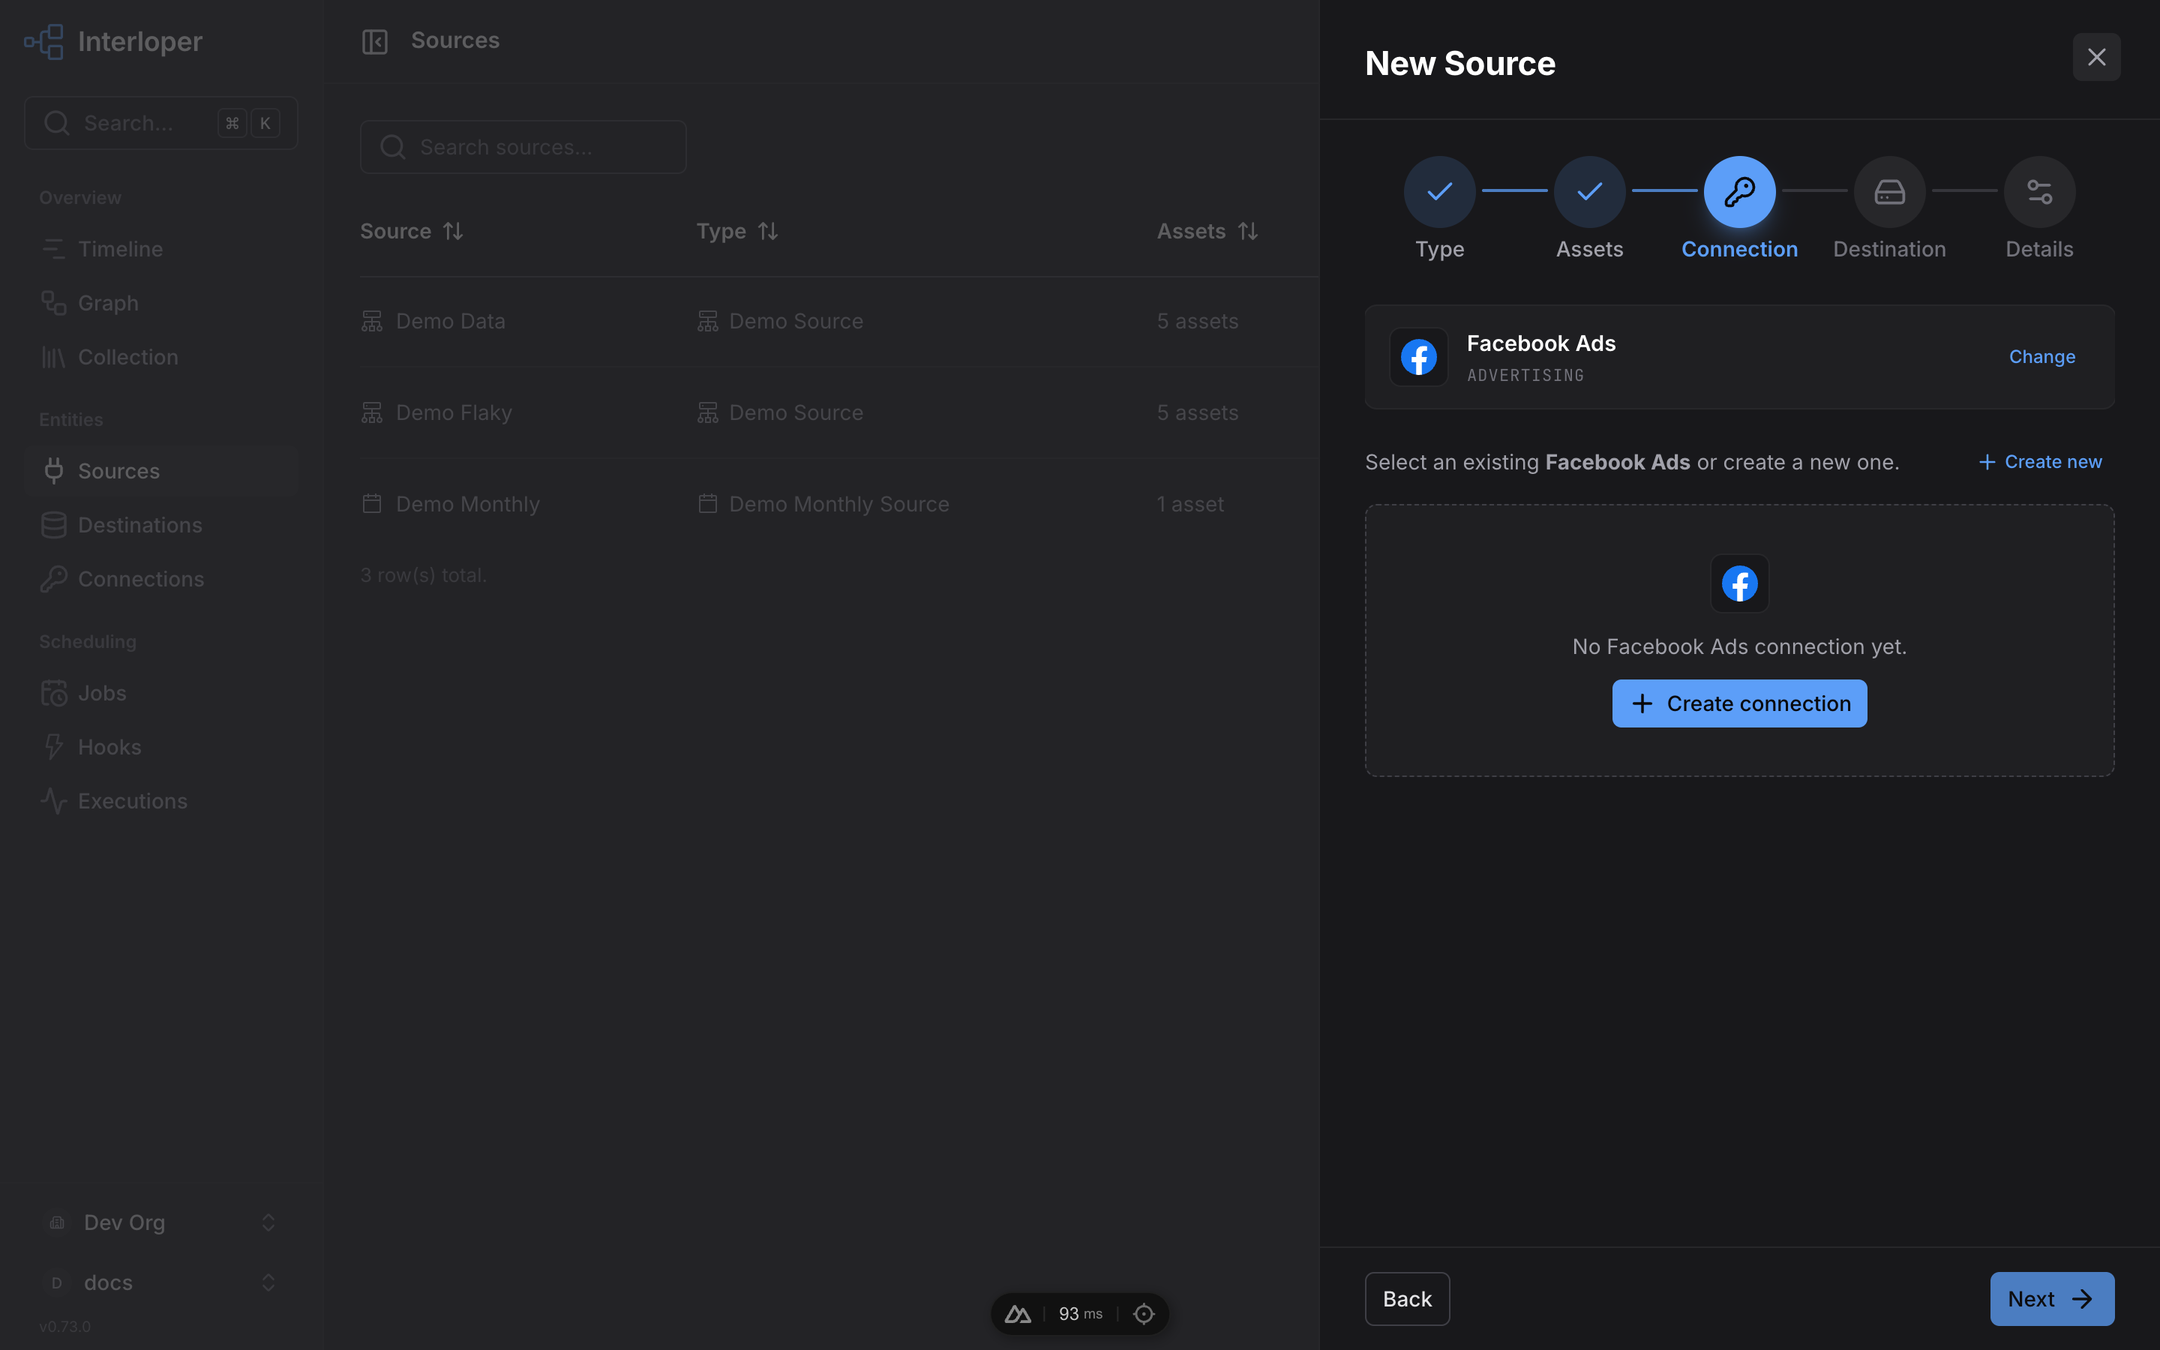
One step per resource relation the source declares. It lists the existing connections of the required key or creates one inline; the connection form is the same as on the Connections page.
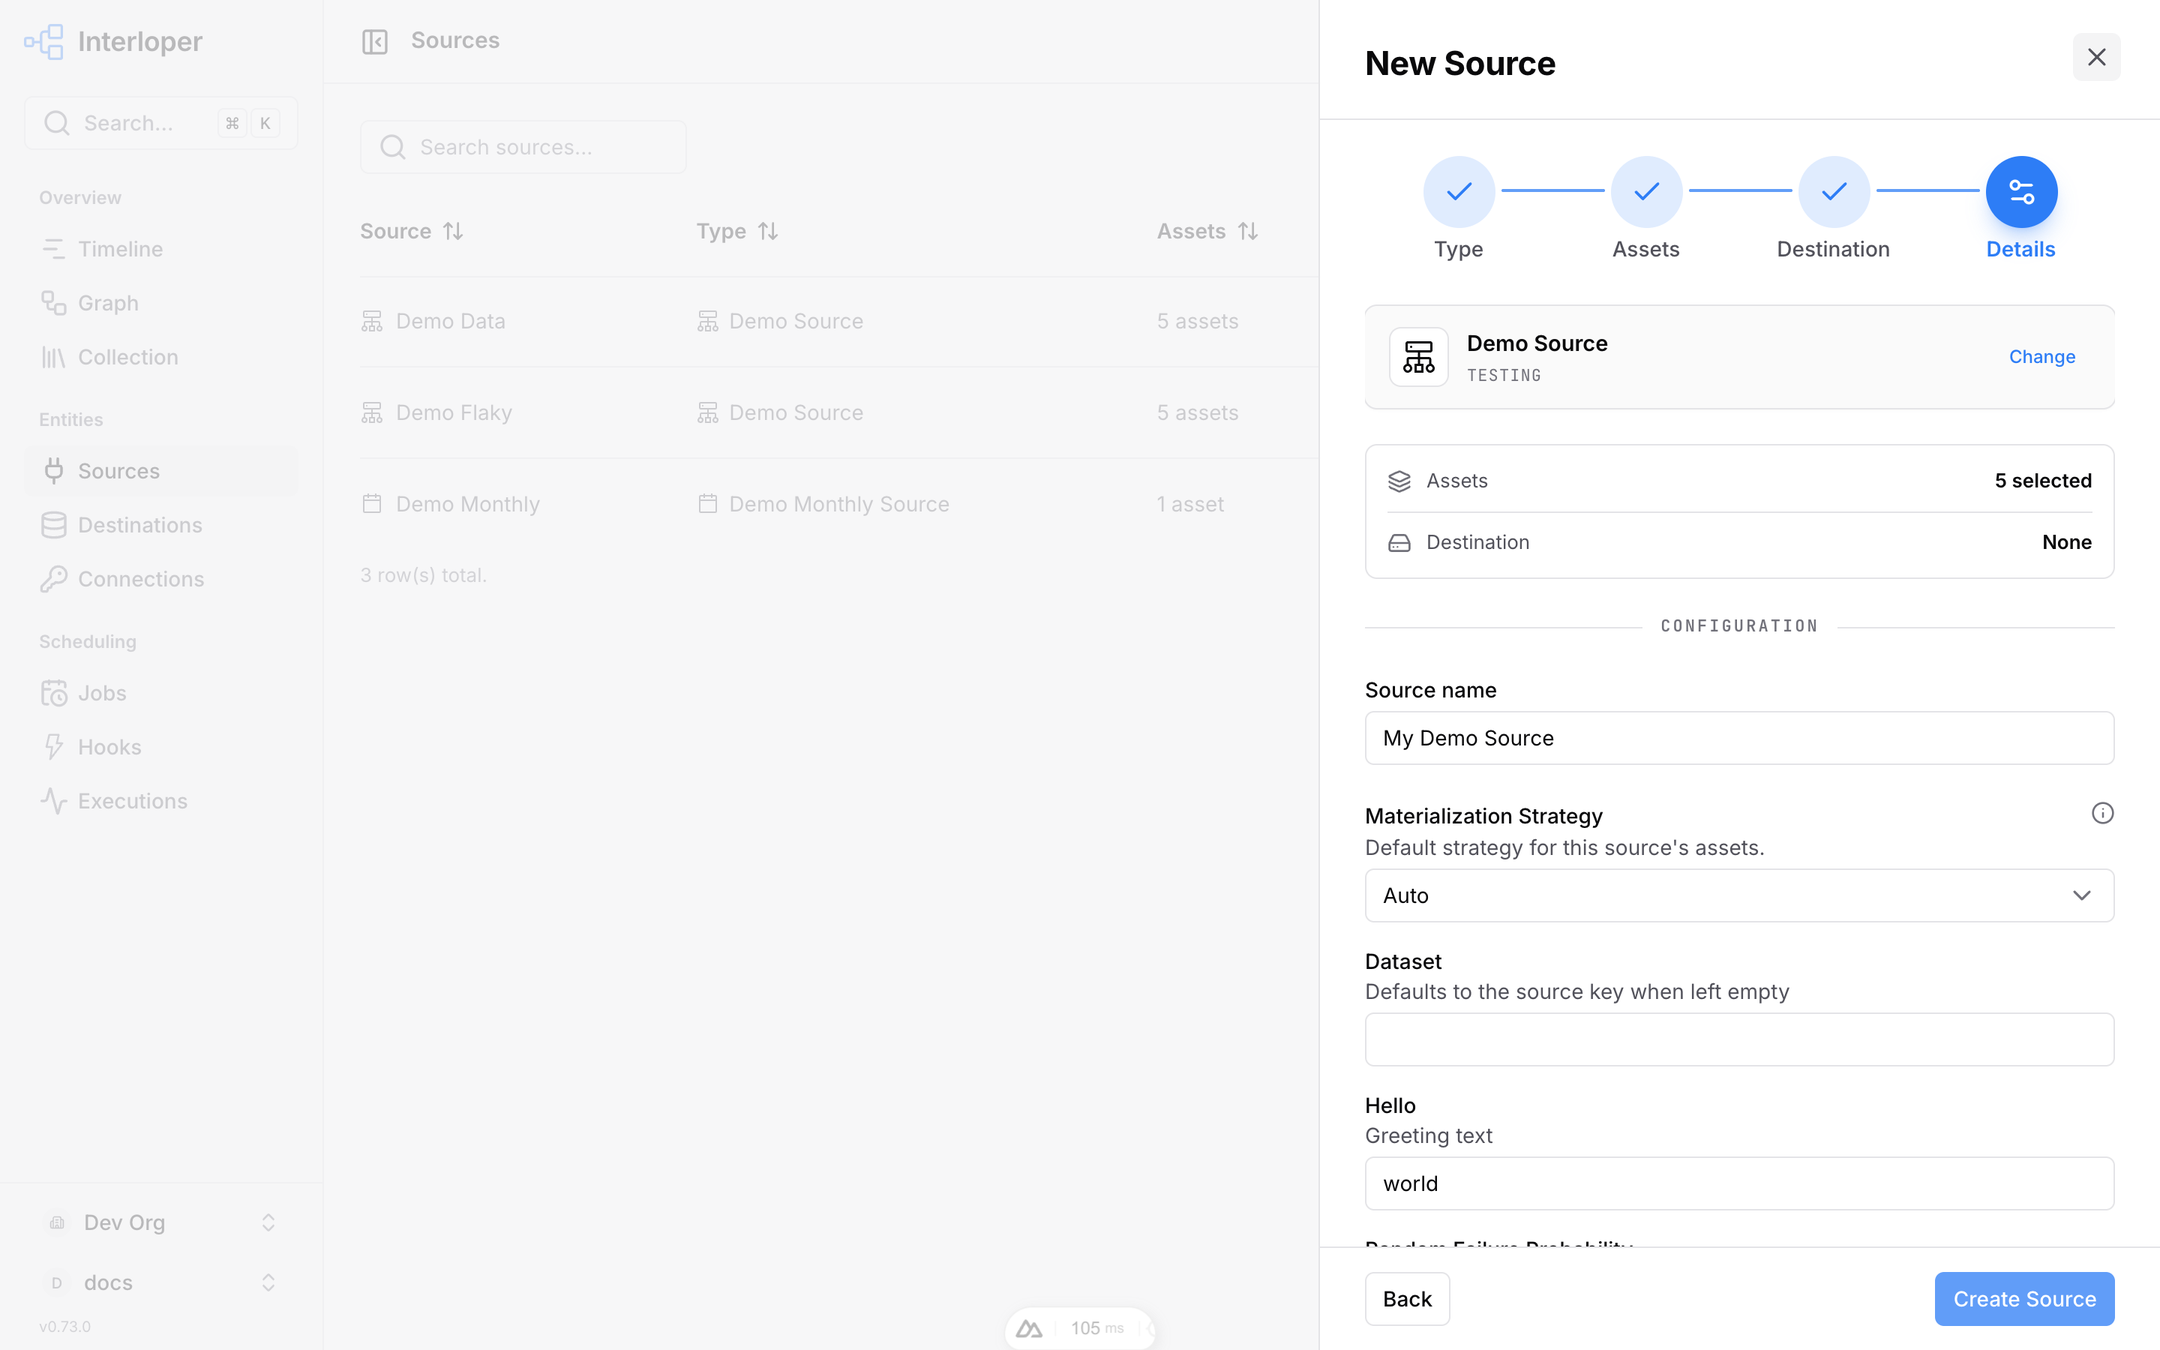
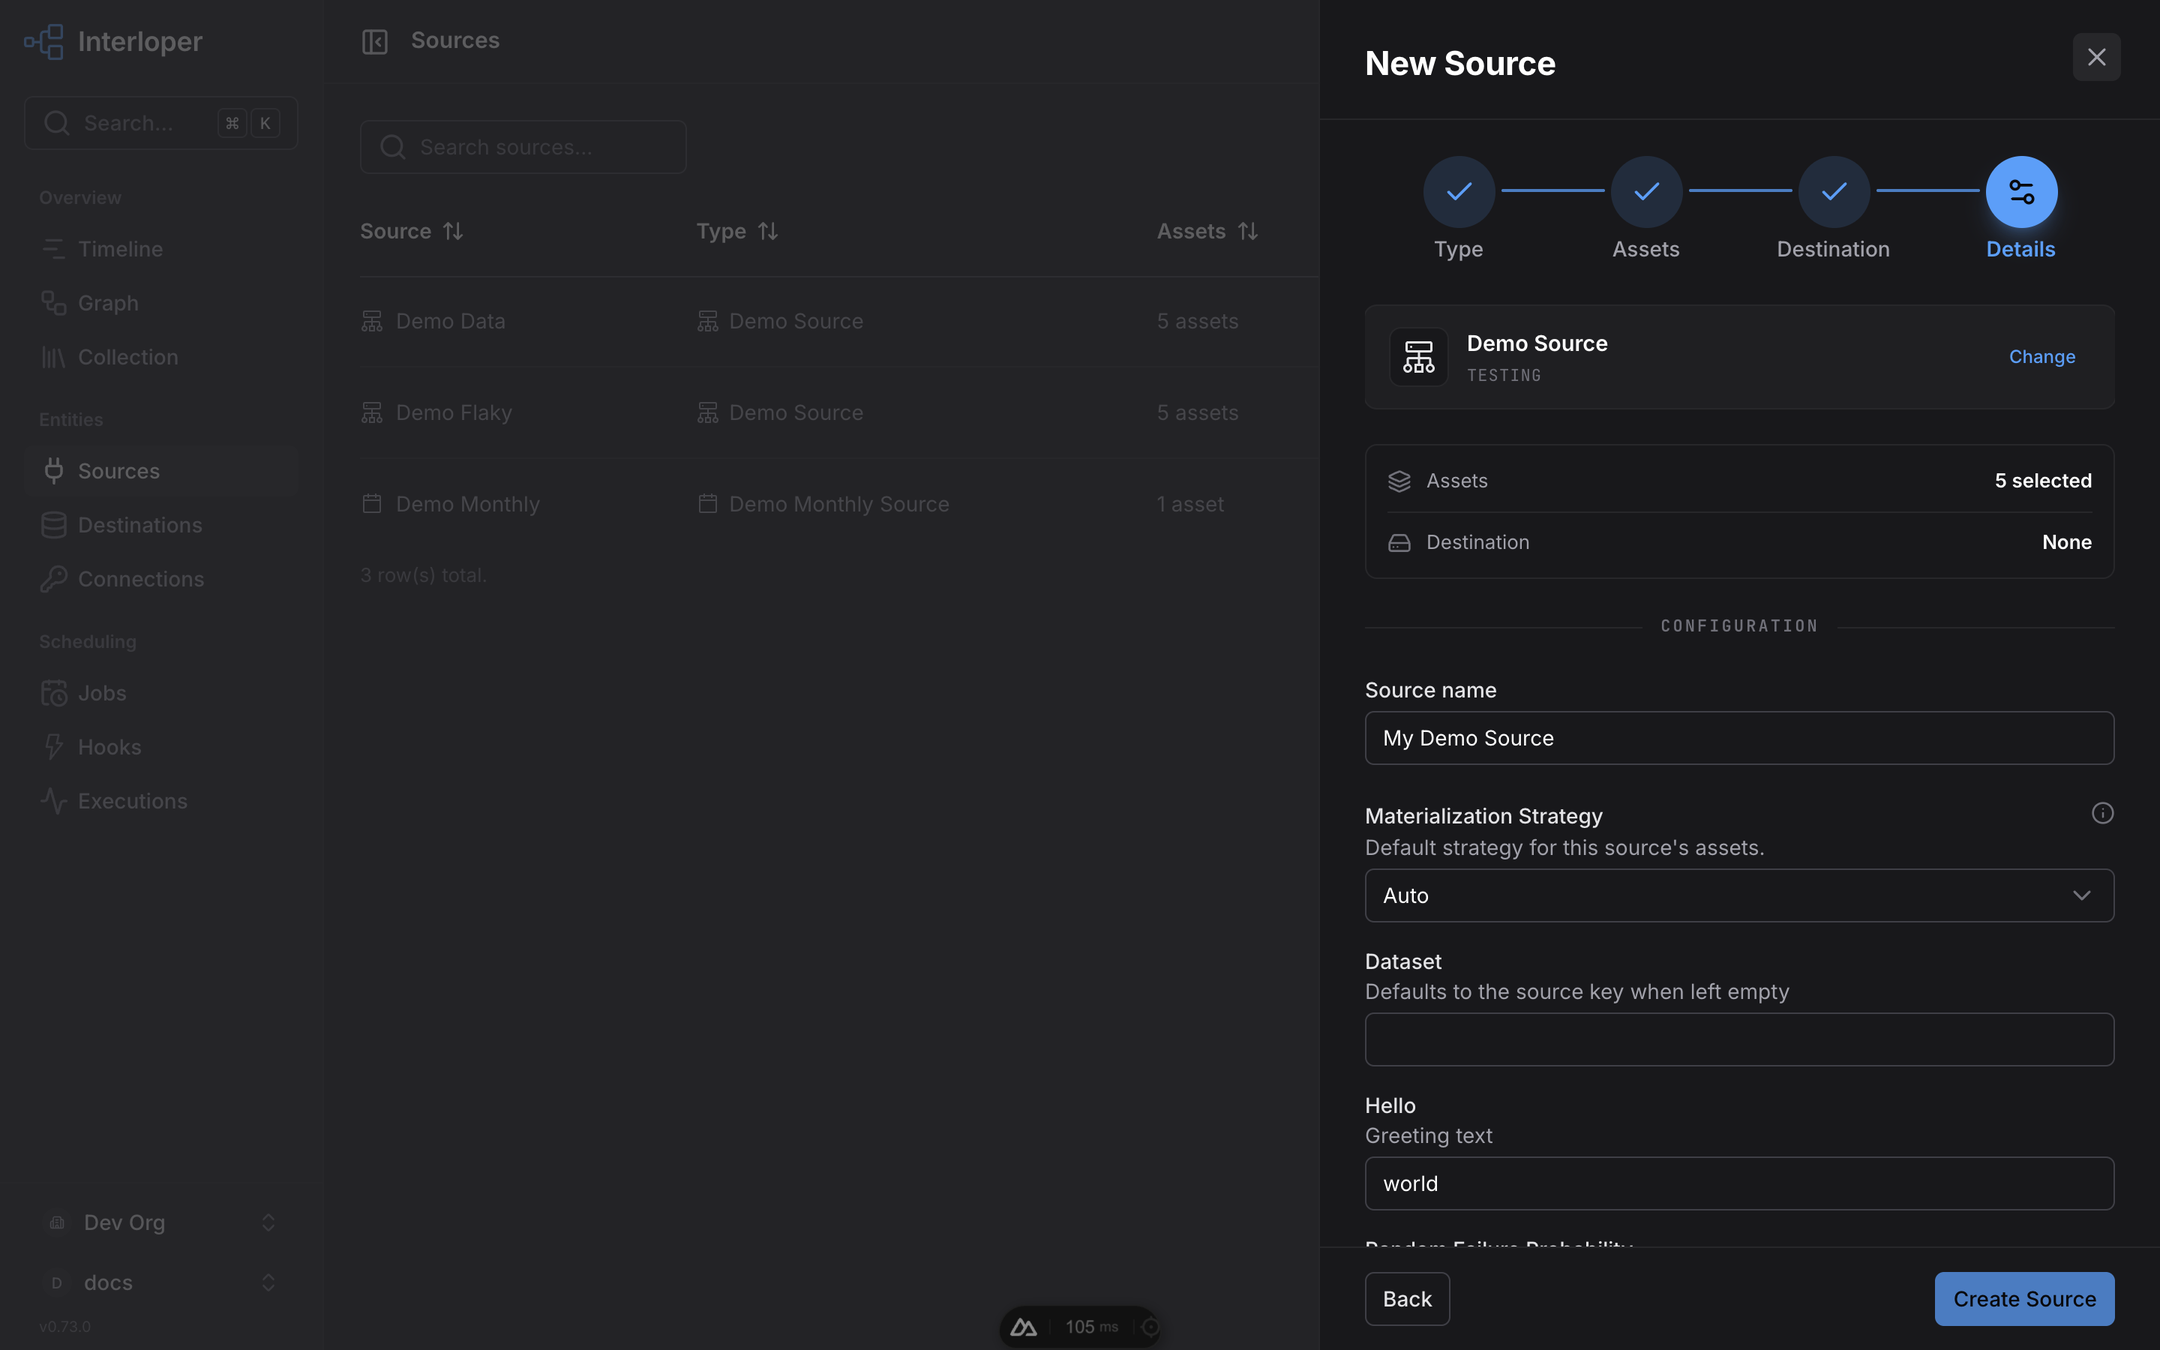
The details step recaps the earlier choices and renders the form generated from the source's
configuration fields: the framework's own (materialization_strategy, dataset) and the
class's (hello, random_failure_probability on the demo source), with the labels,
descriptions and tooltips their field helpers declare.
Connections
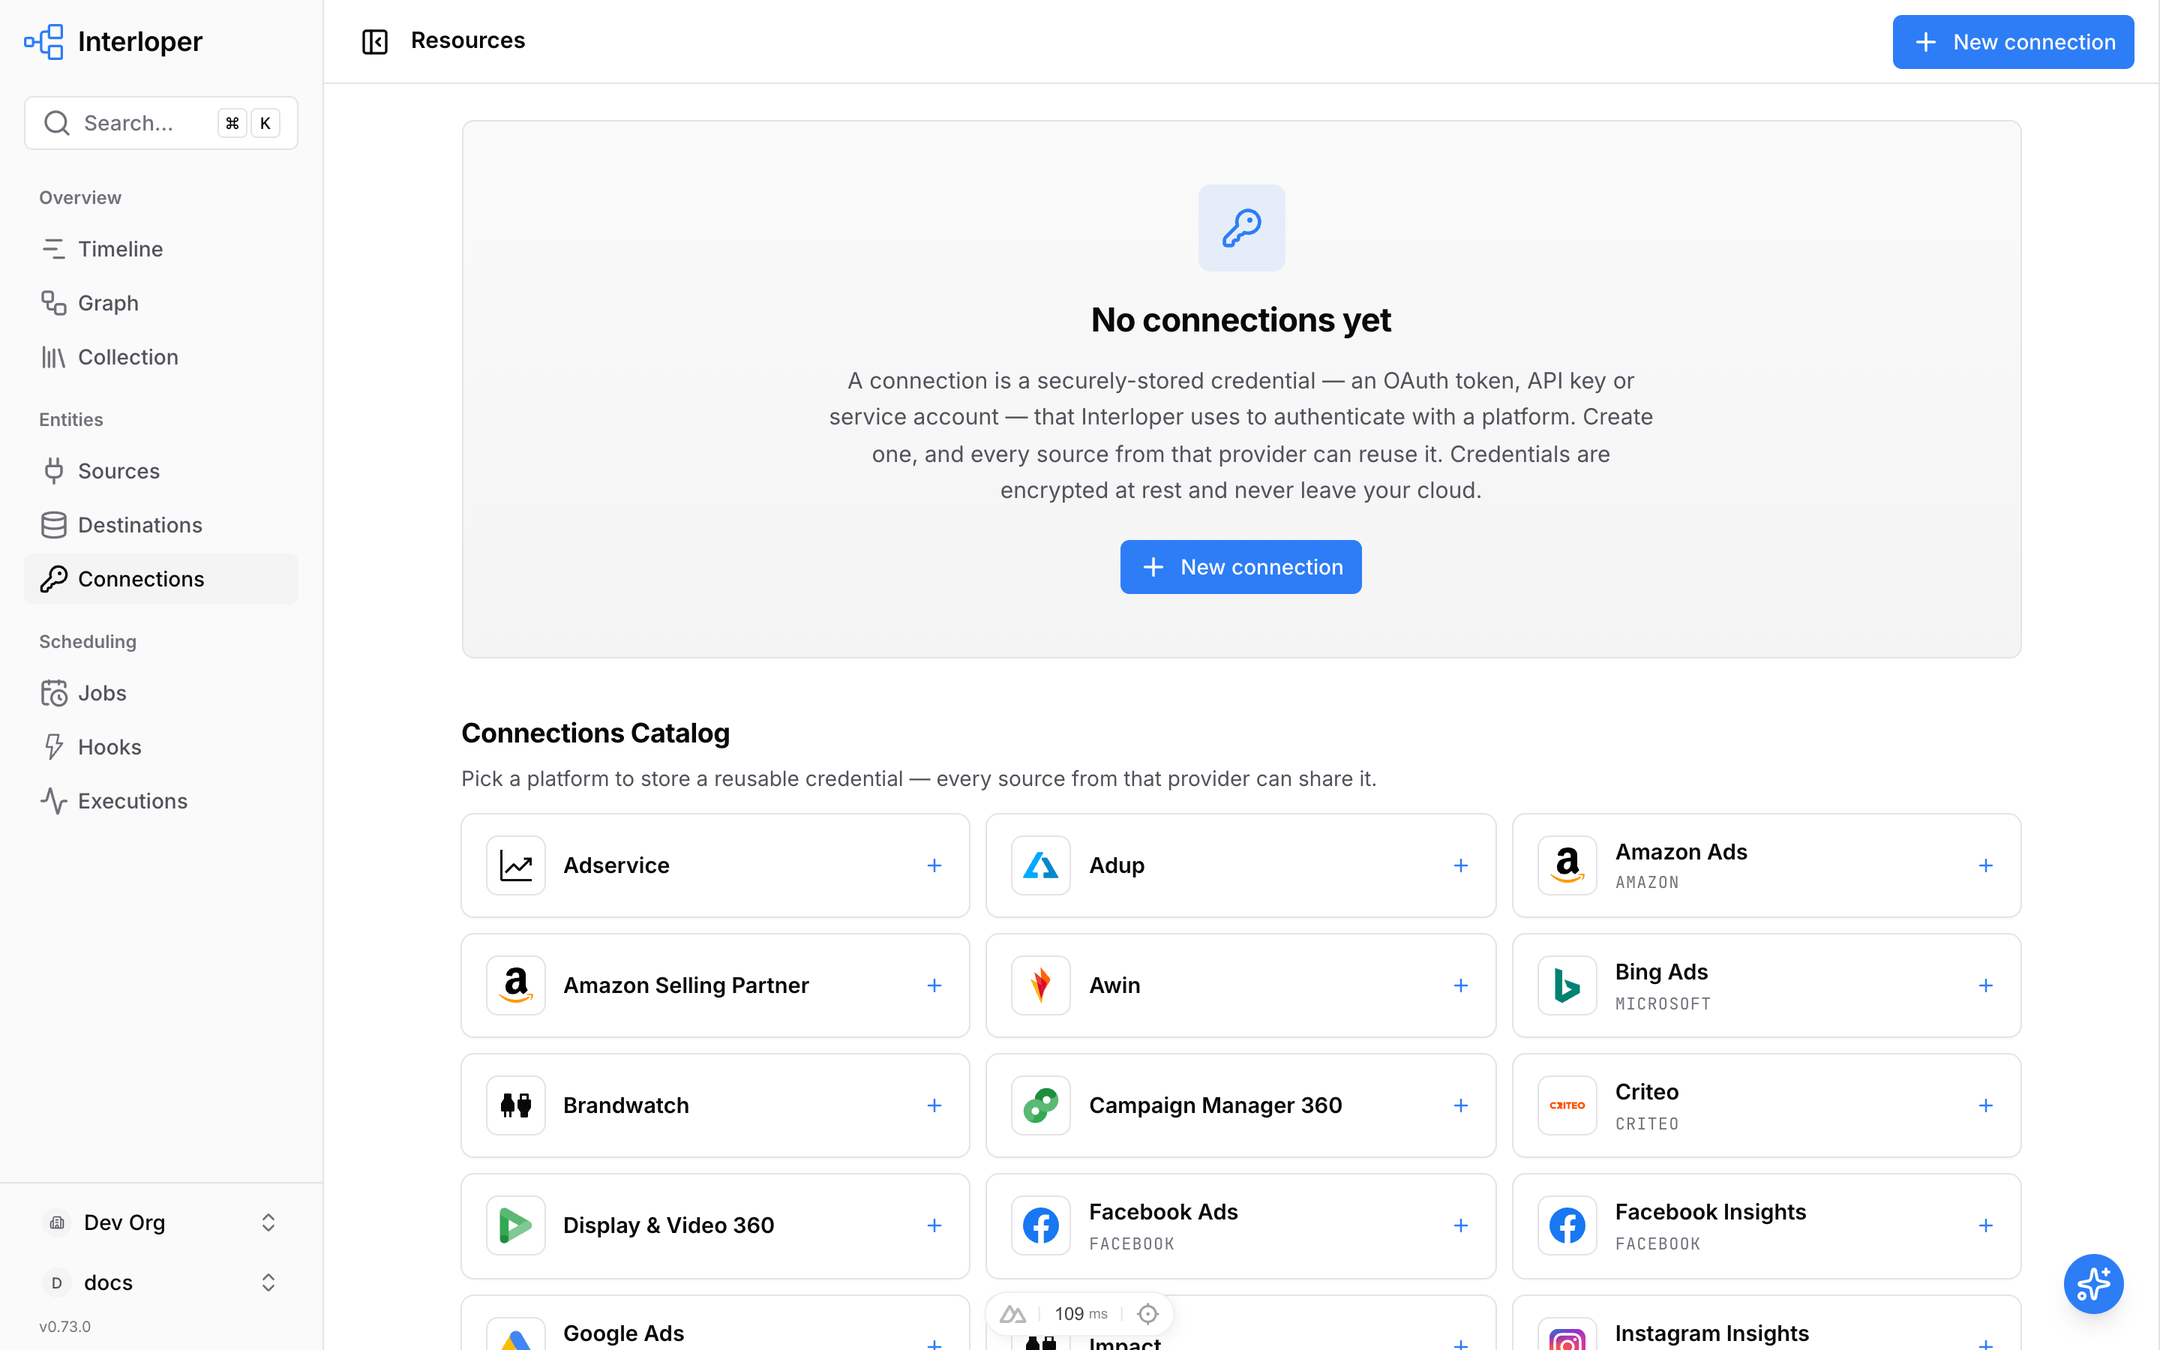
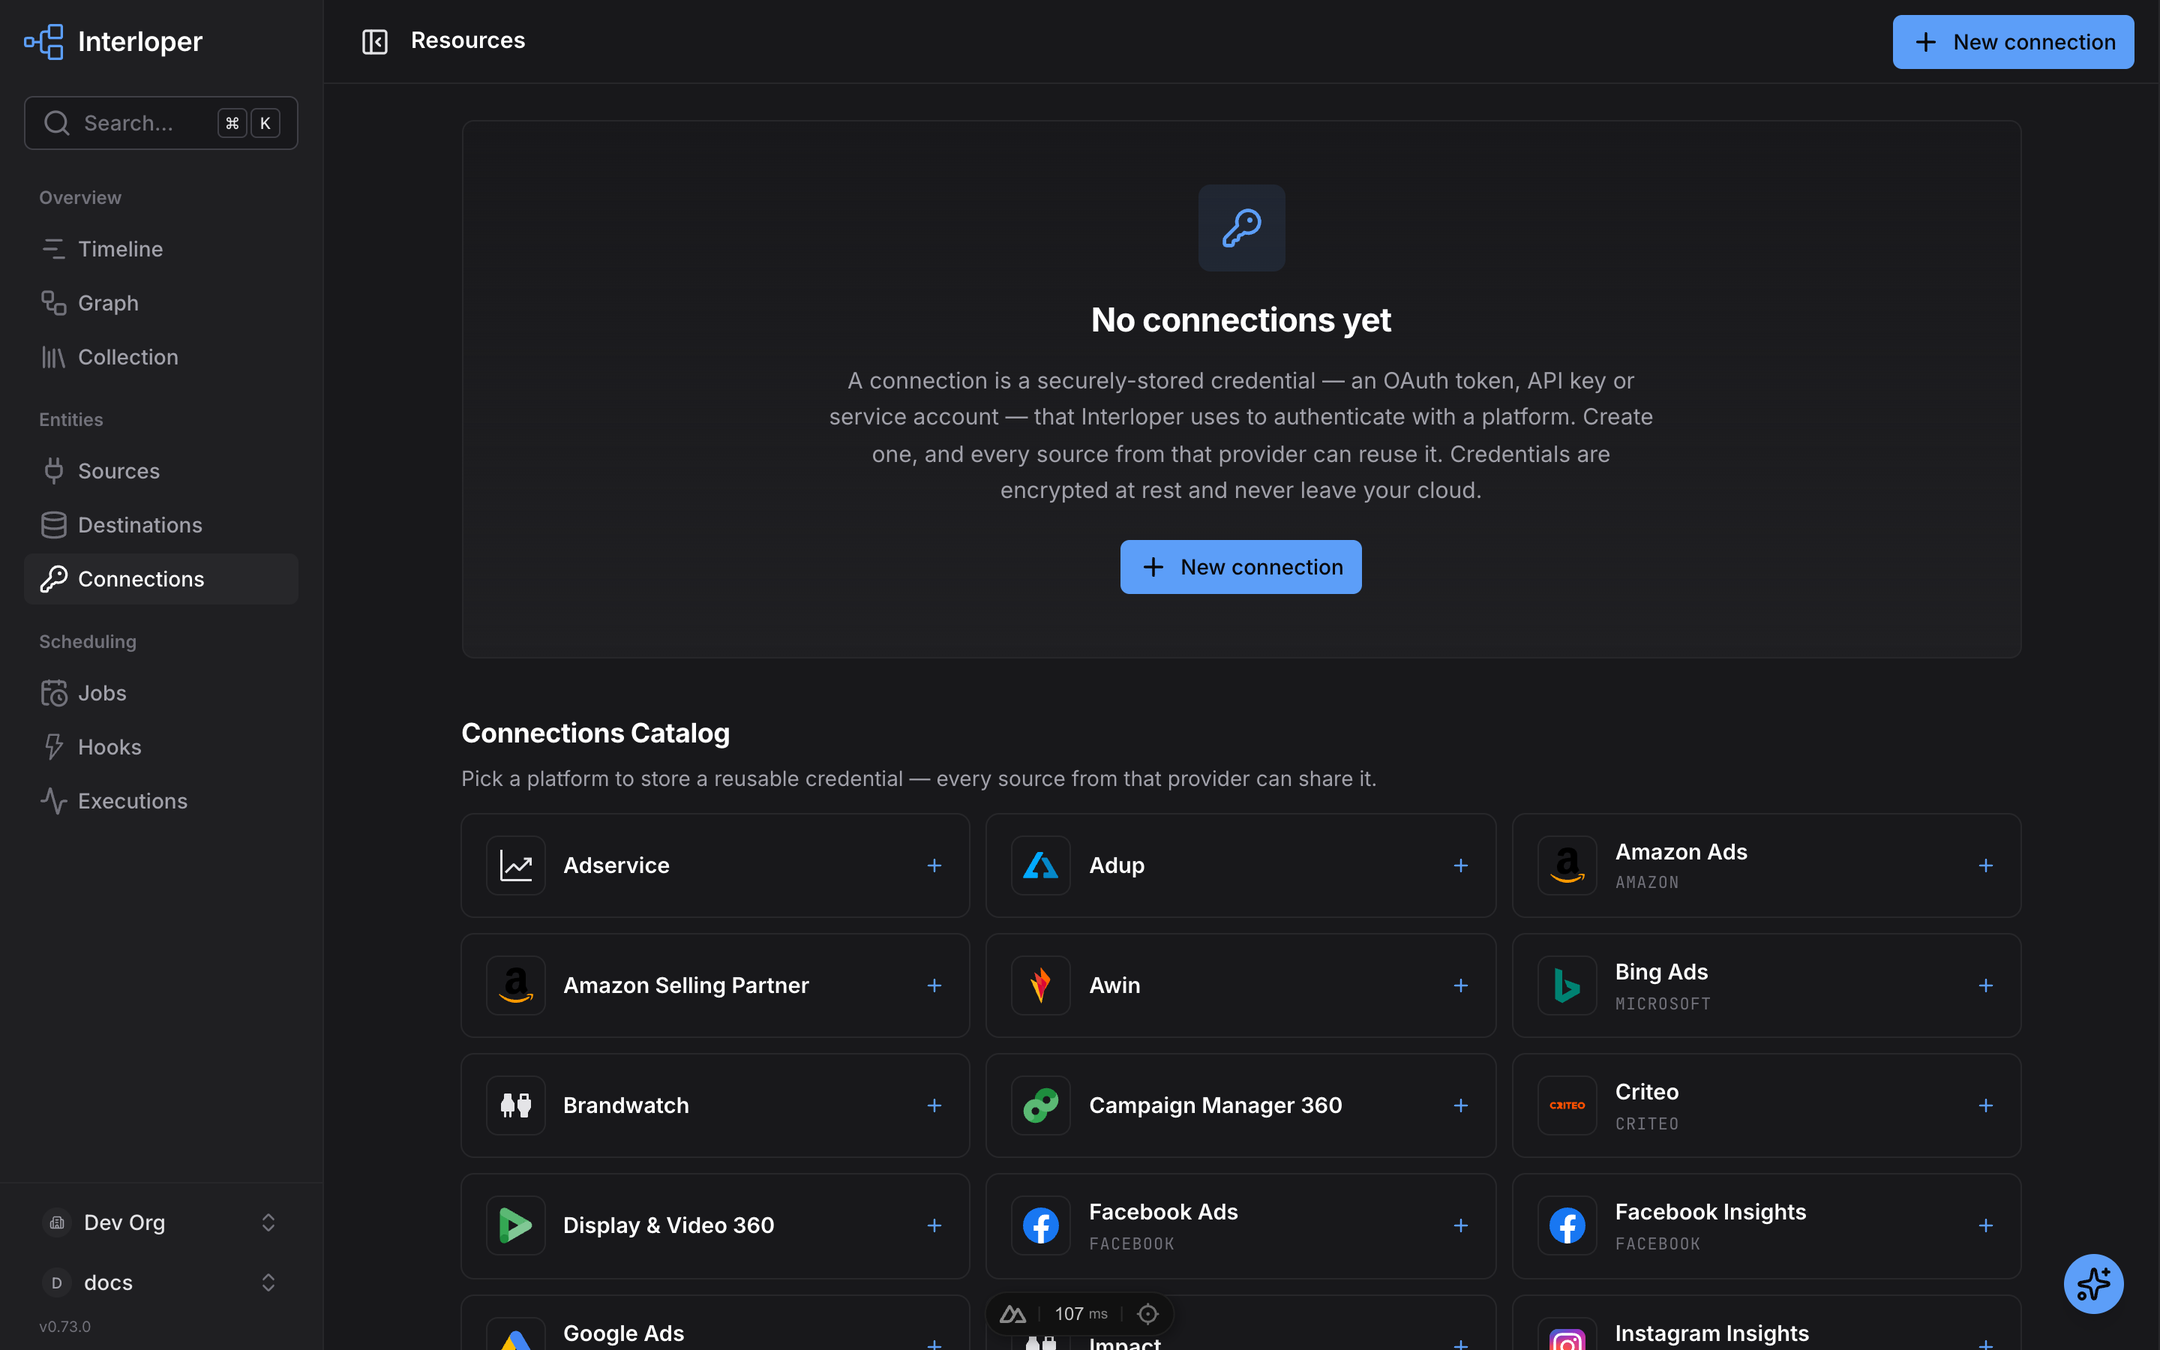
Credentials, stored encrypted and shared by every source that needs them. The page lists the
configured connections and, below, the catalog of connection types installed. The sidebar entry
exists because the catalog contains the connection resource kind; a package defining another
kind gets its own entry.
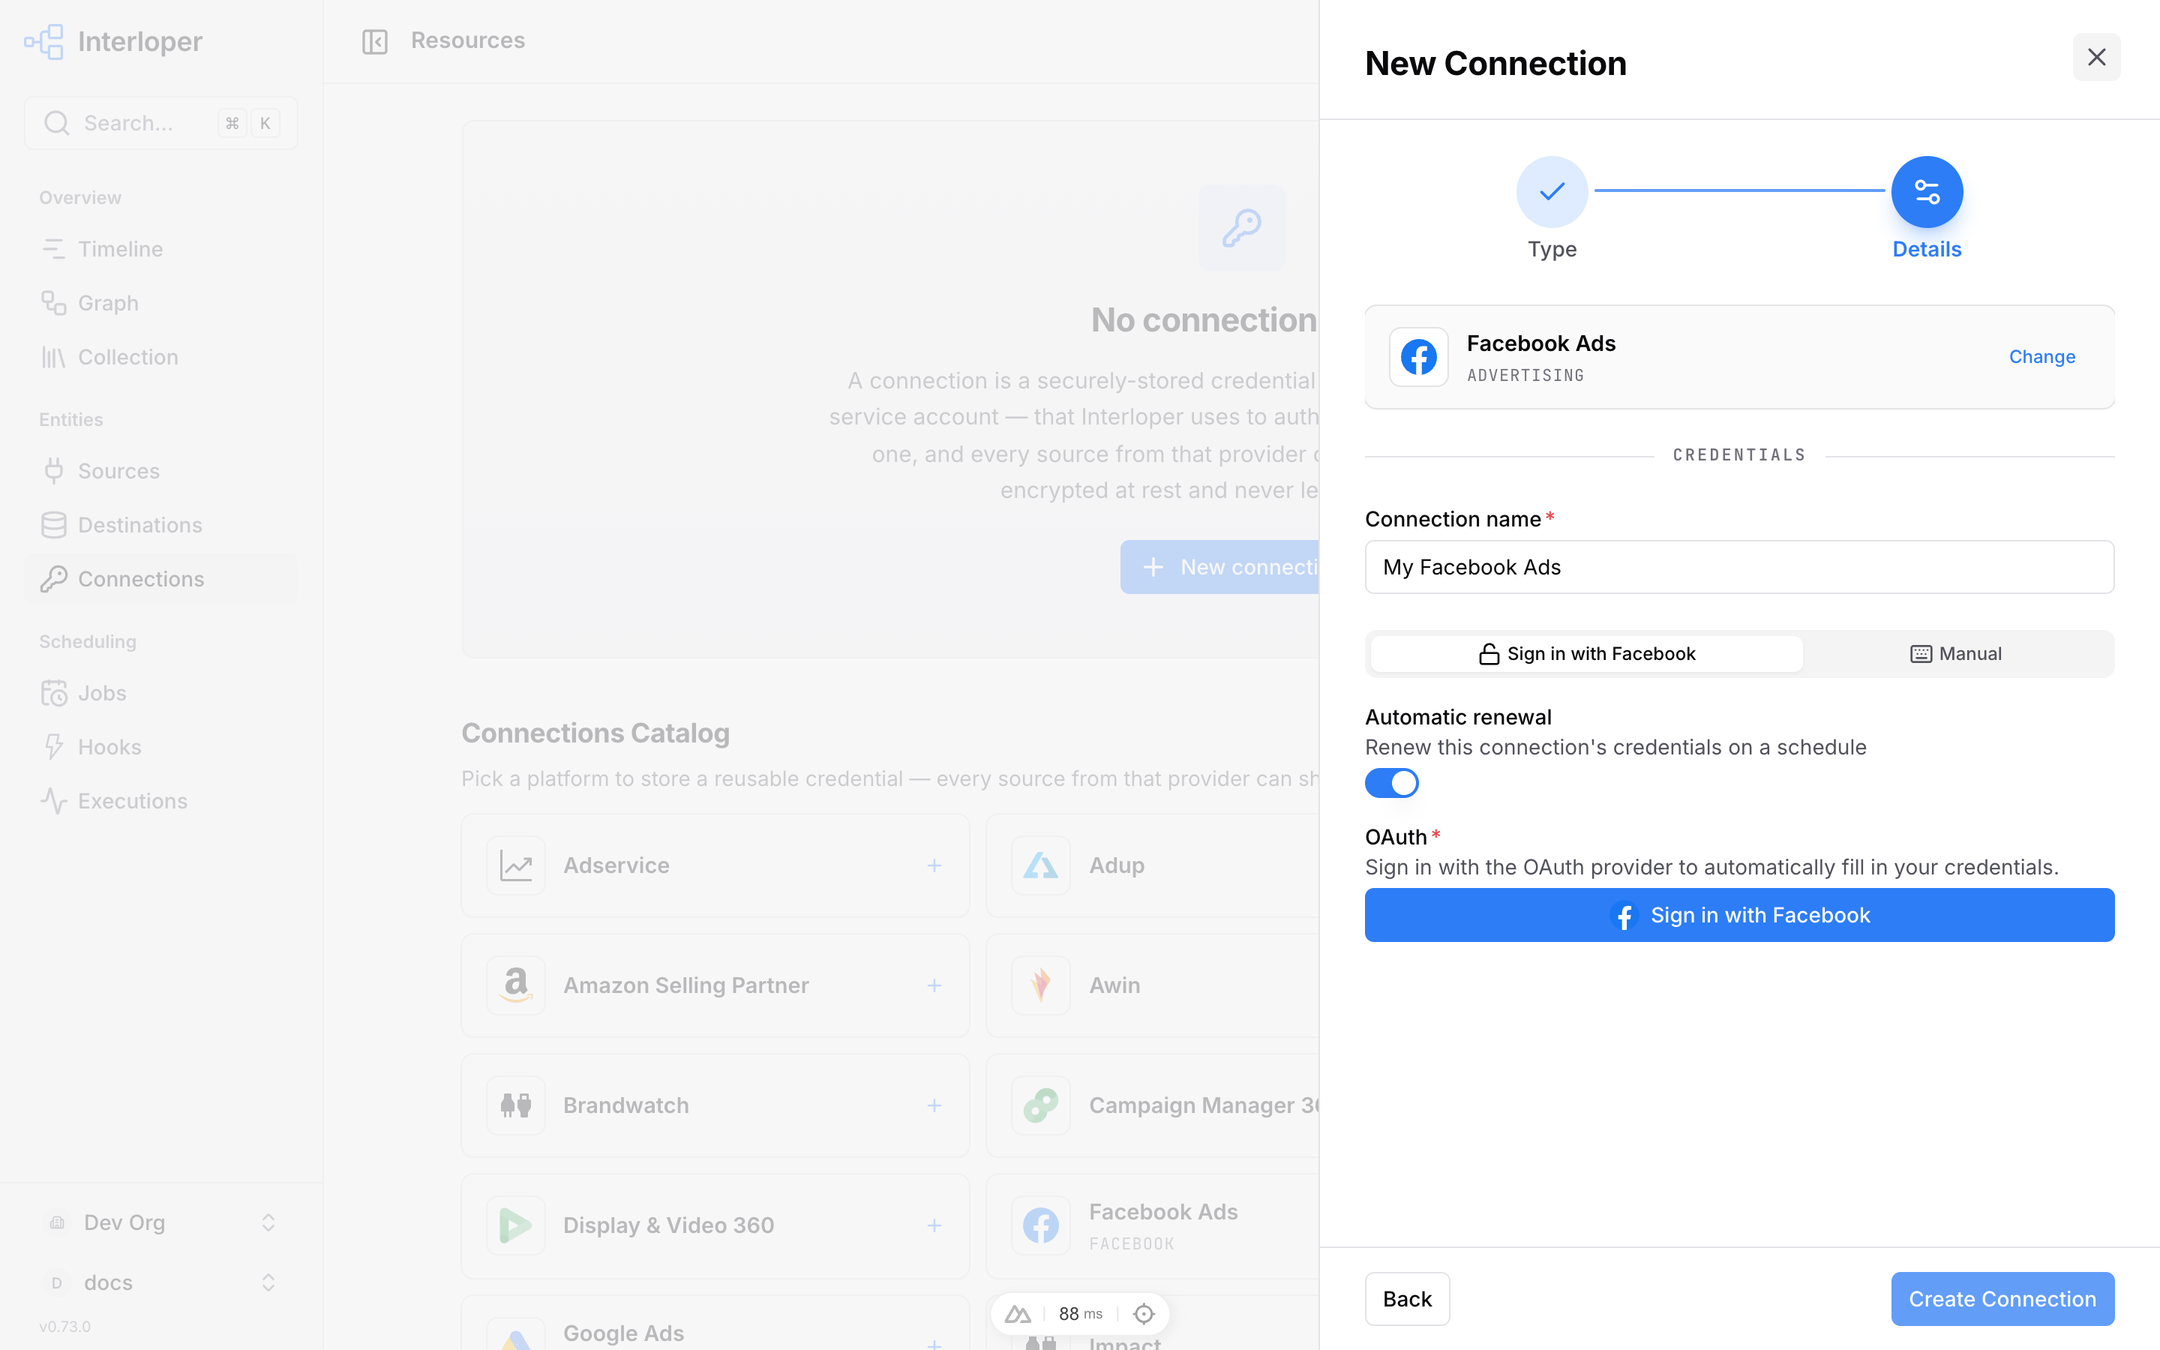
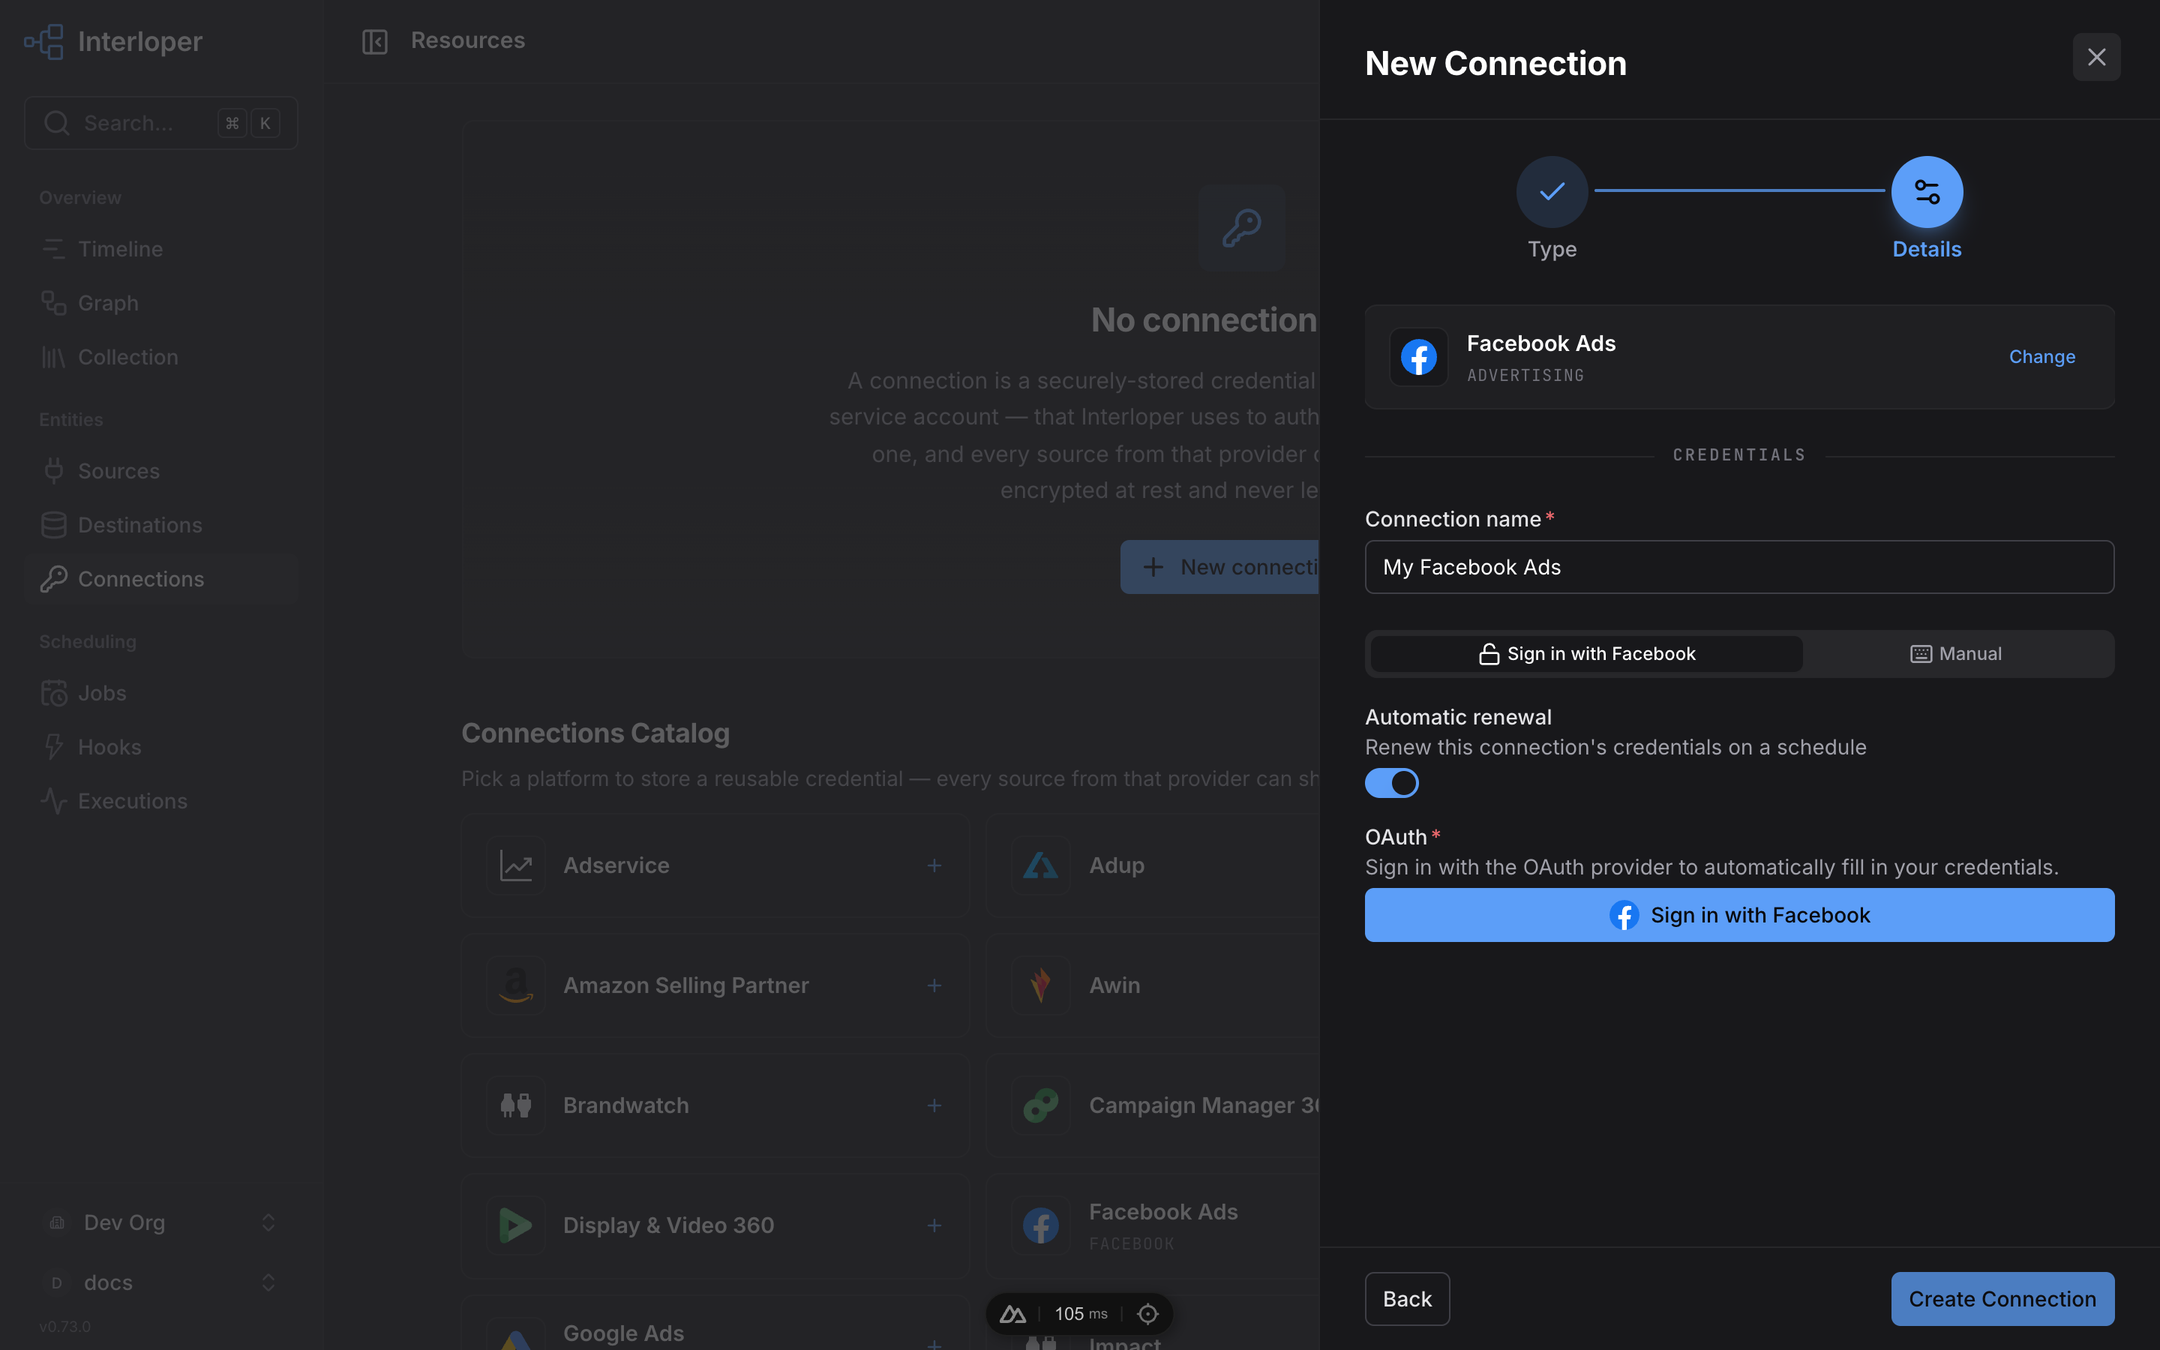
A connection declaring OAuthConfig gets a sign-in tab when the provider's app credentials are
configured on the server, and a manual tab showing every field. The auto_renew toggle appears
because the class is renewable; a "Test connection" action appears when it implements check().
Destinations
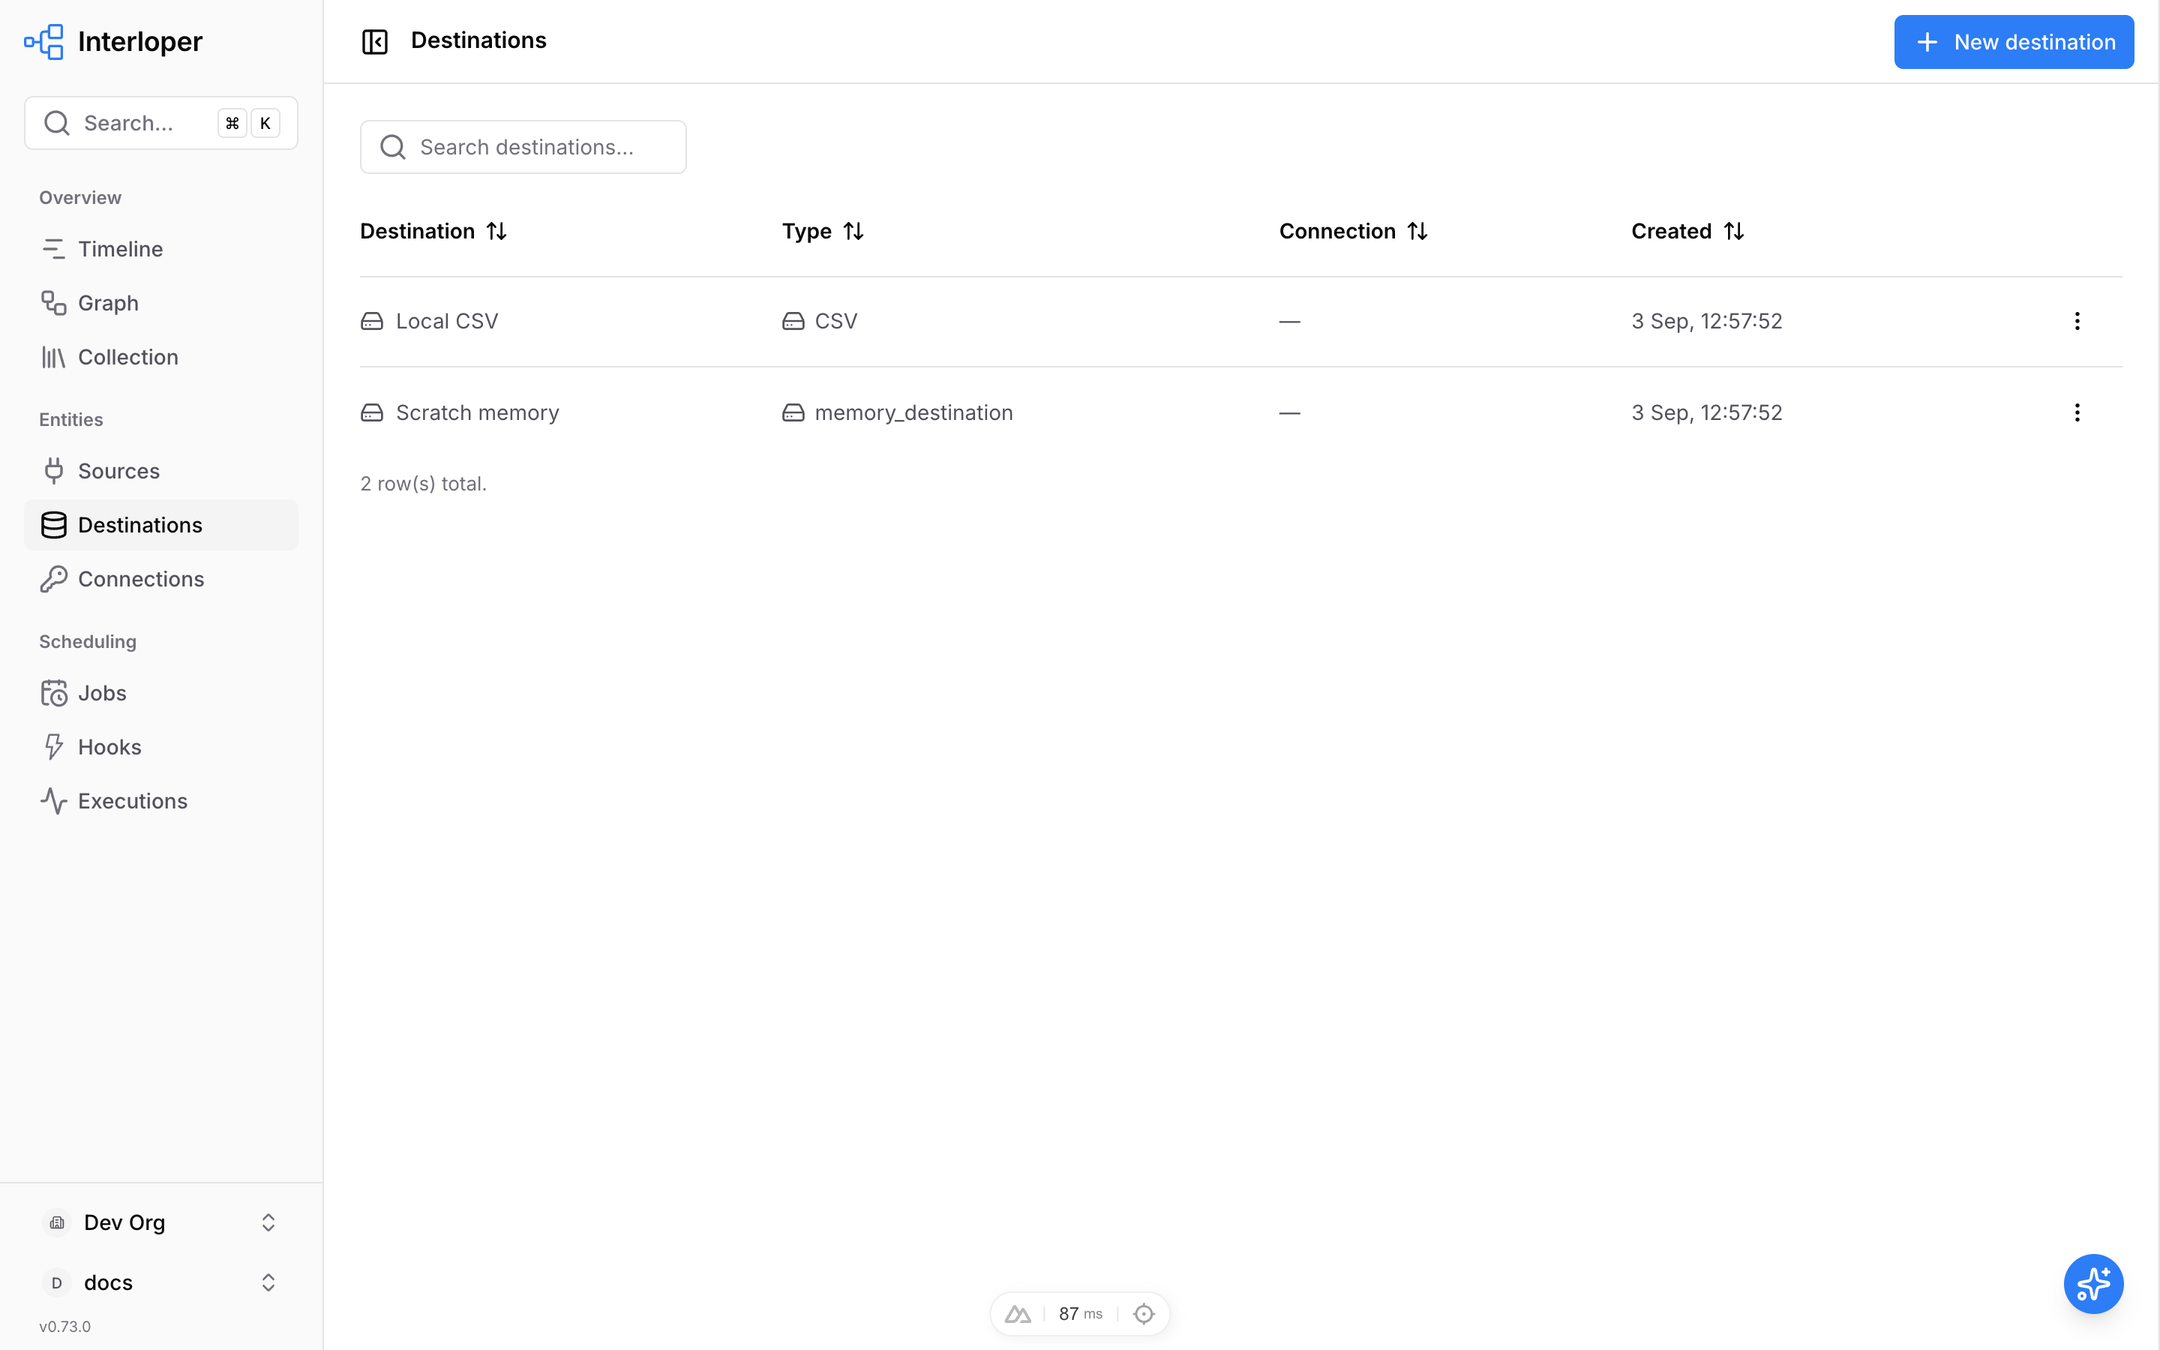
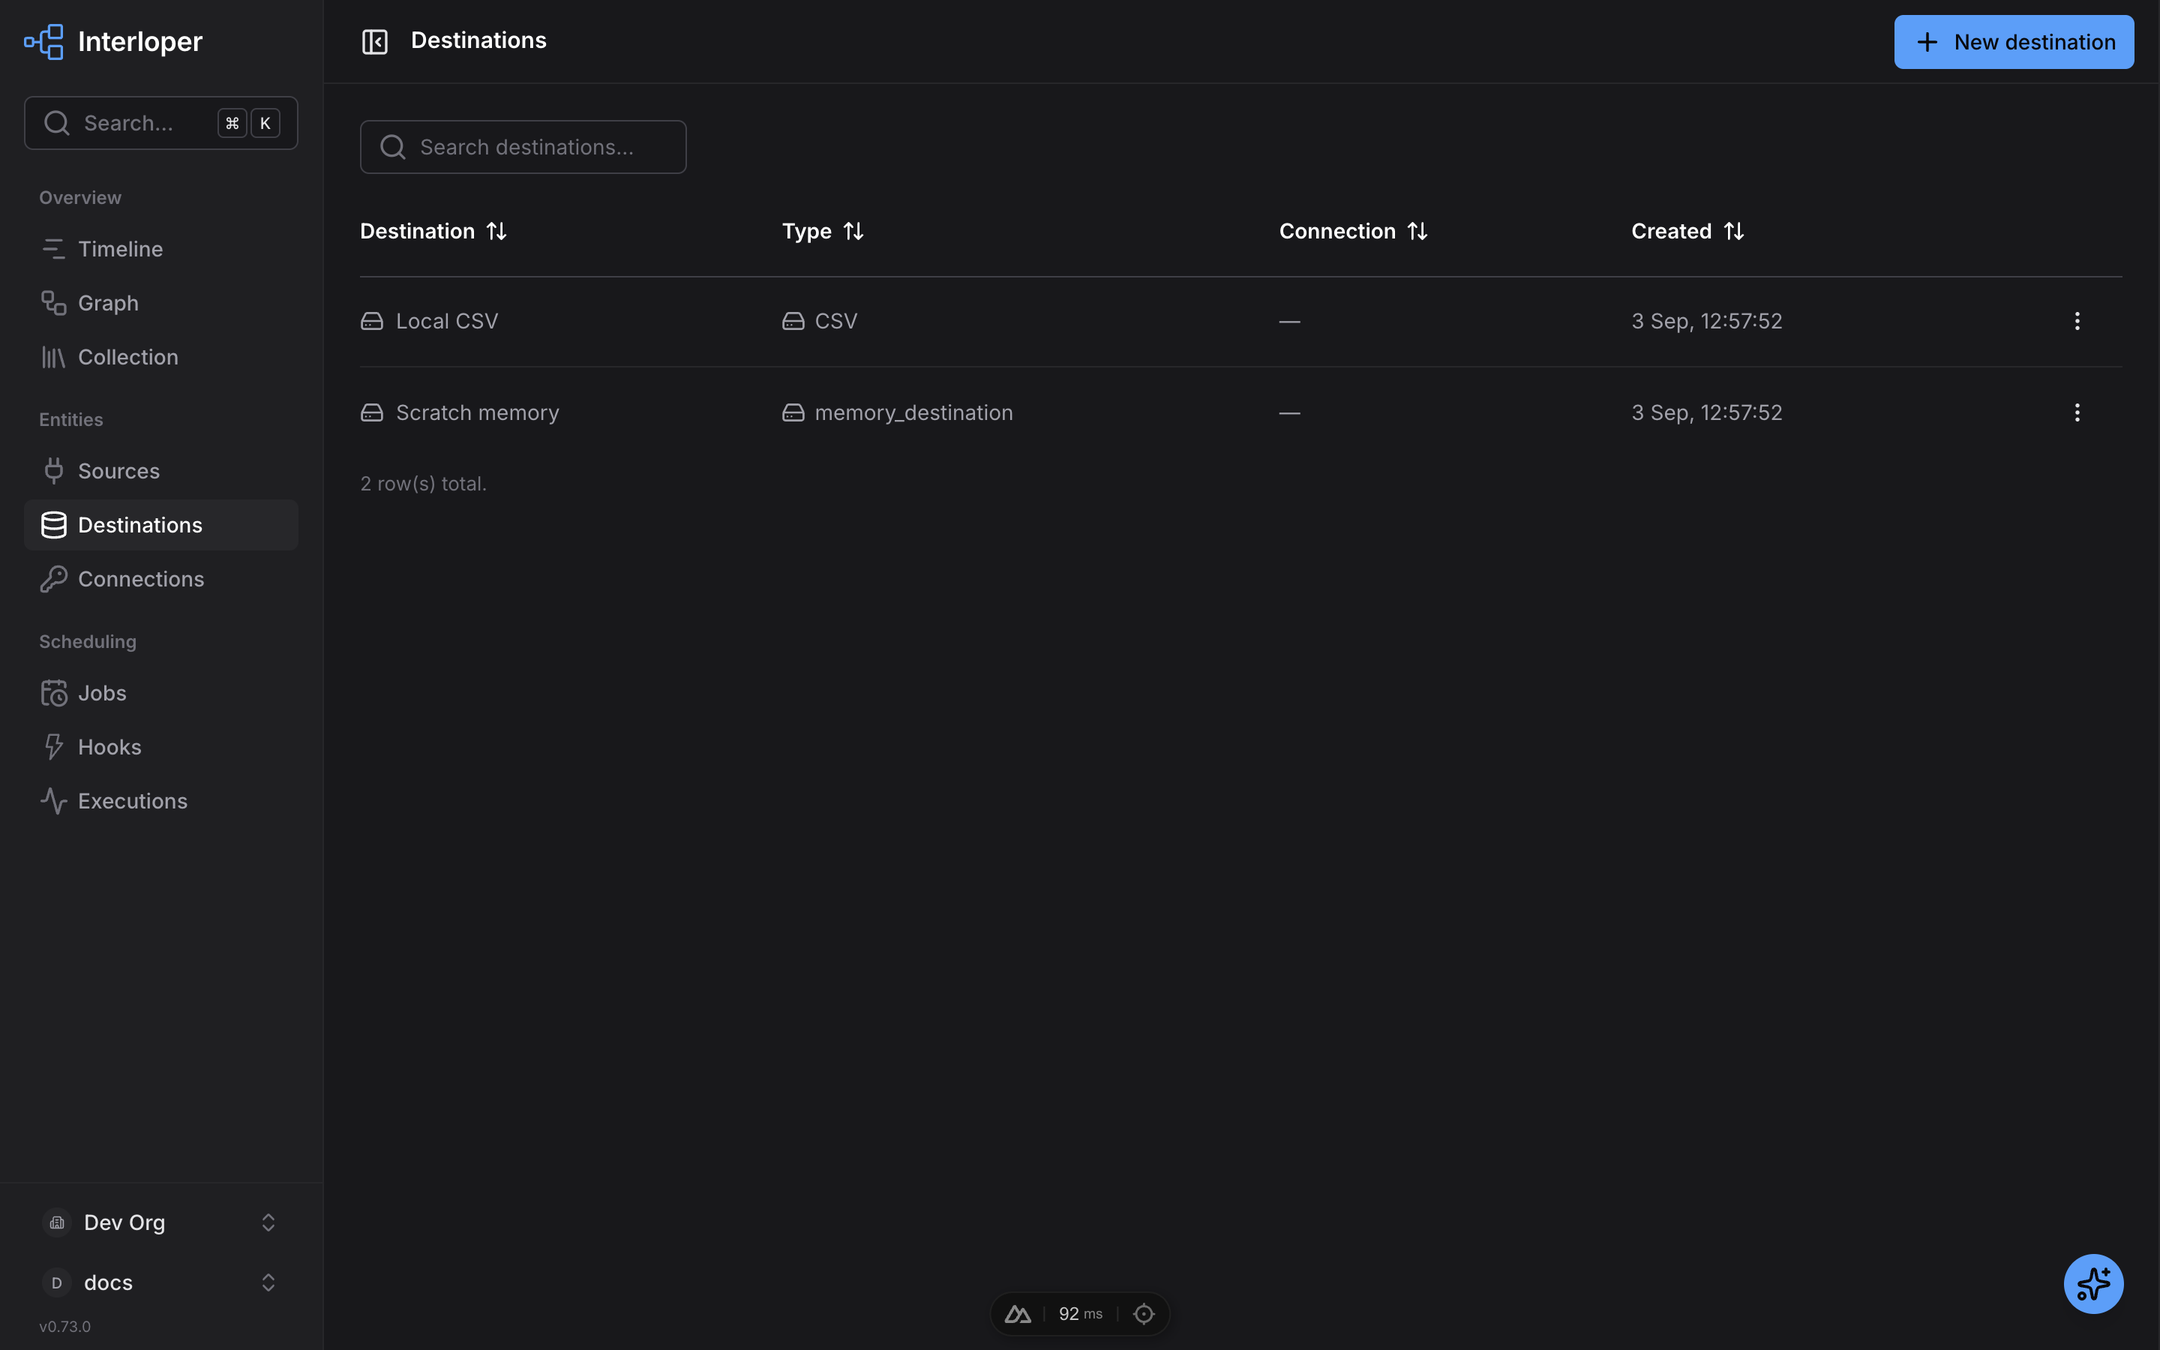
Where data lands. A destination's form comes from its configuration fields, and its connection relation, when it declares one, is a picker over the matching connections.
Jobs
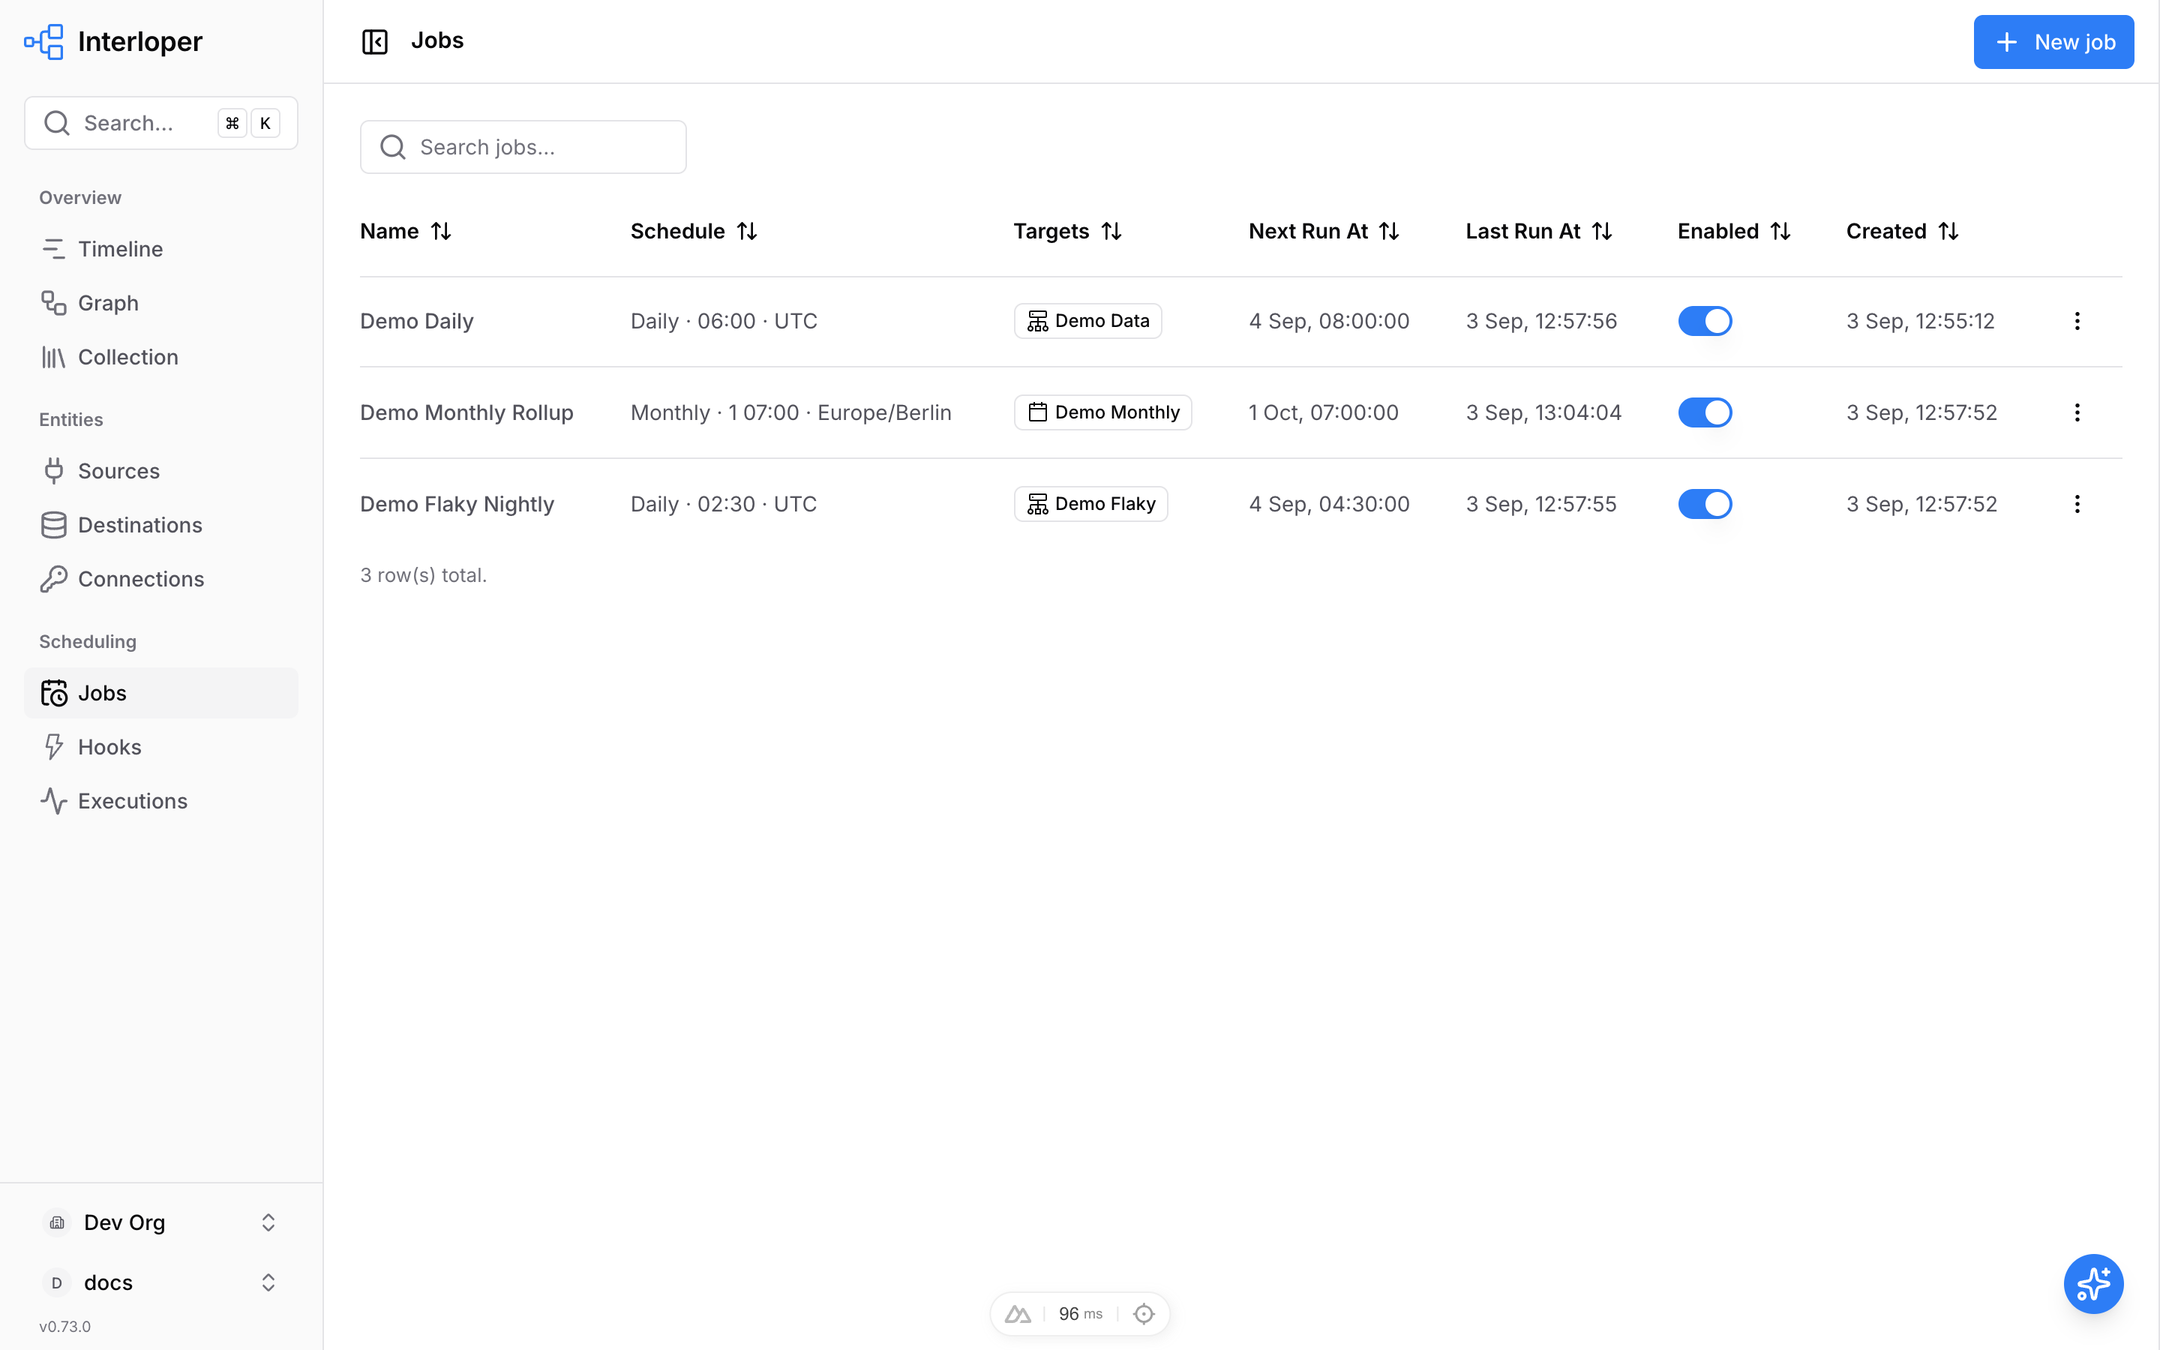
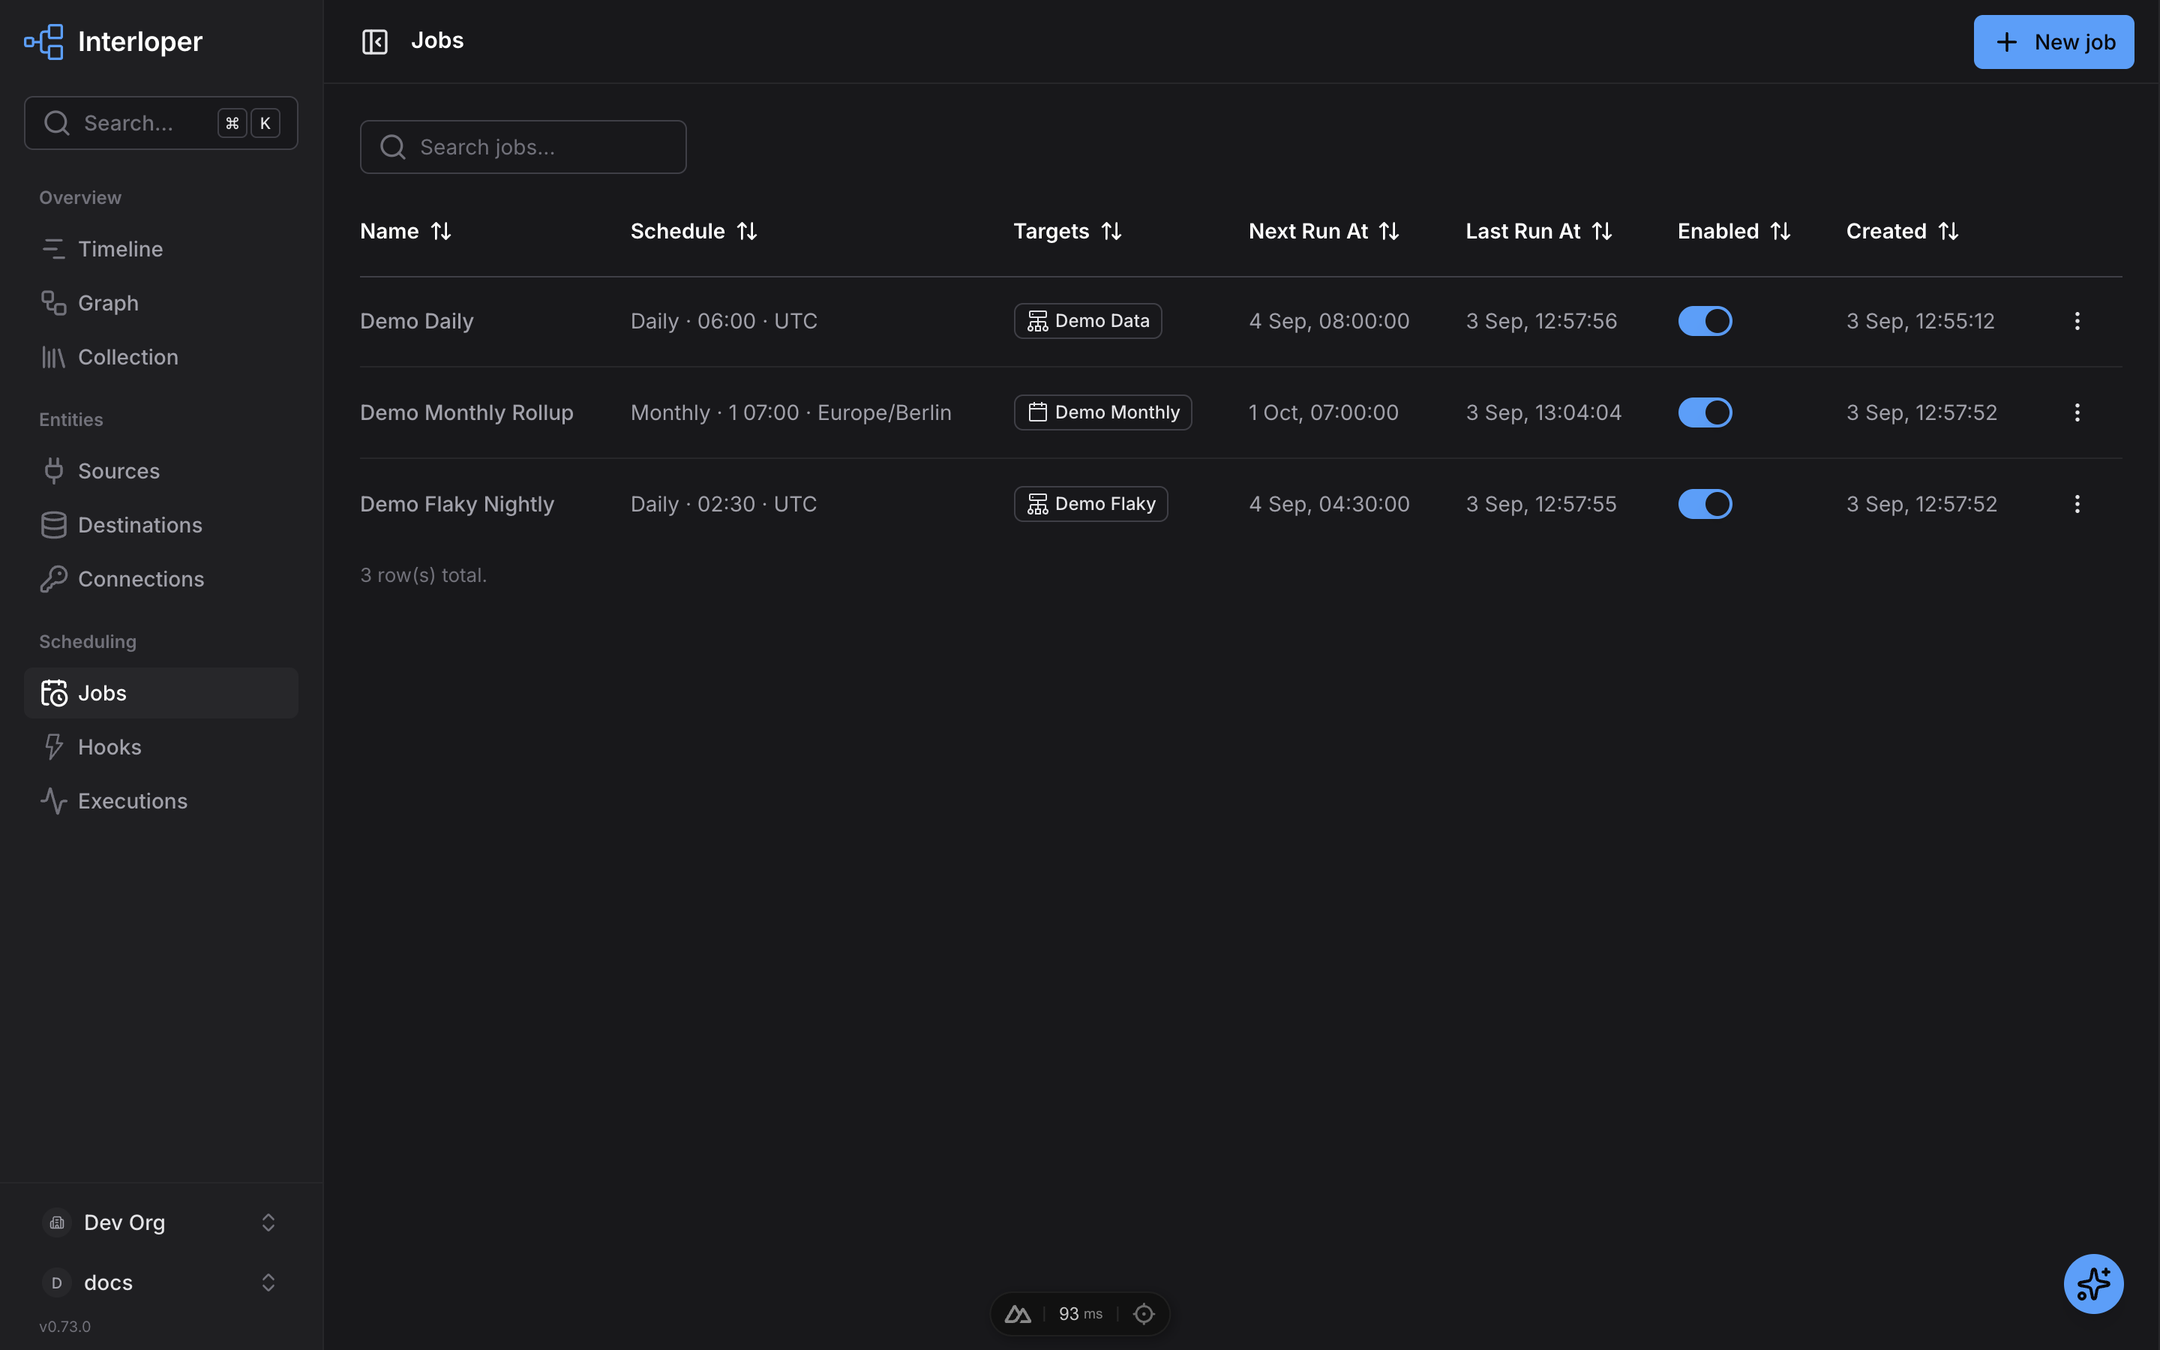
Cron jobs over sources or assets. The schedule column renders the cron expression and its
timezone; "Next run at" and "Last run at" are the job's state model, shown as columns because
the definition publishes a state_schema. The job form uses the cron and timezone widgets and
the partition-window fields (lookback, offset); its Operation section carries concurrency,
how many of a firing's partitions run at once.
Hooks
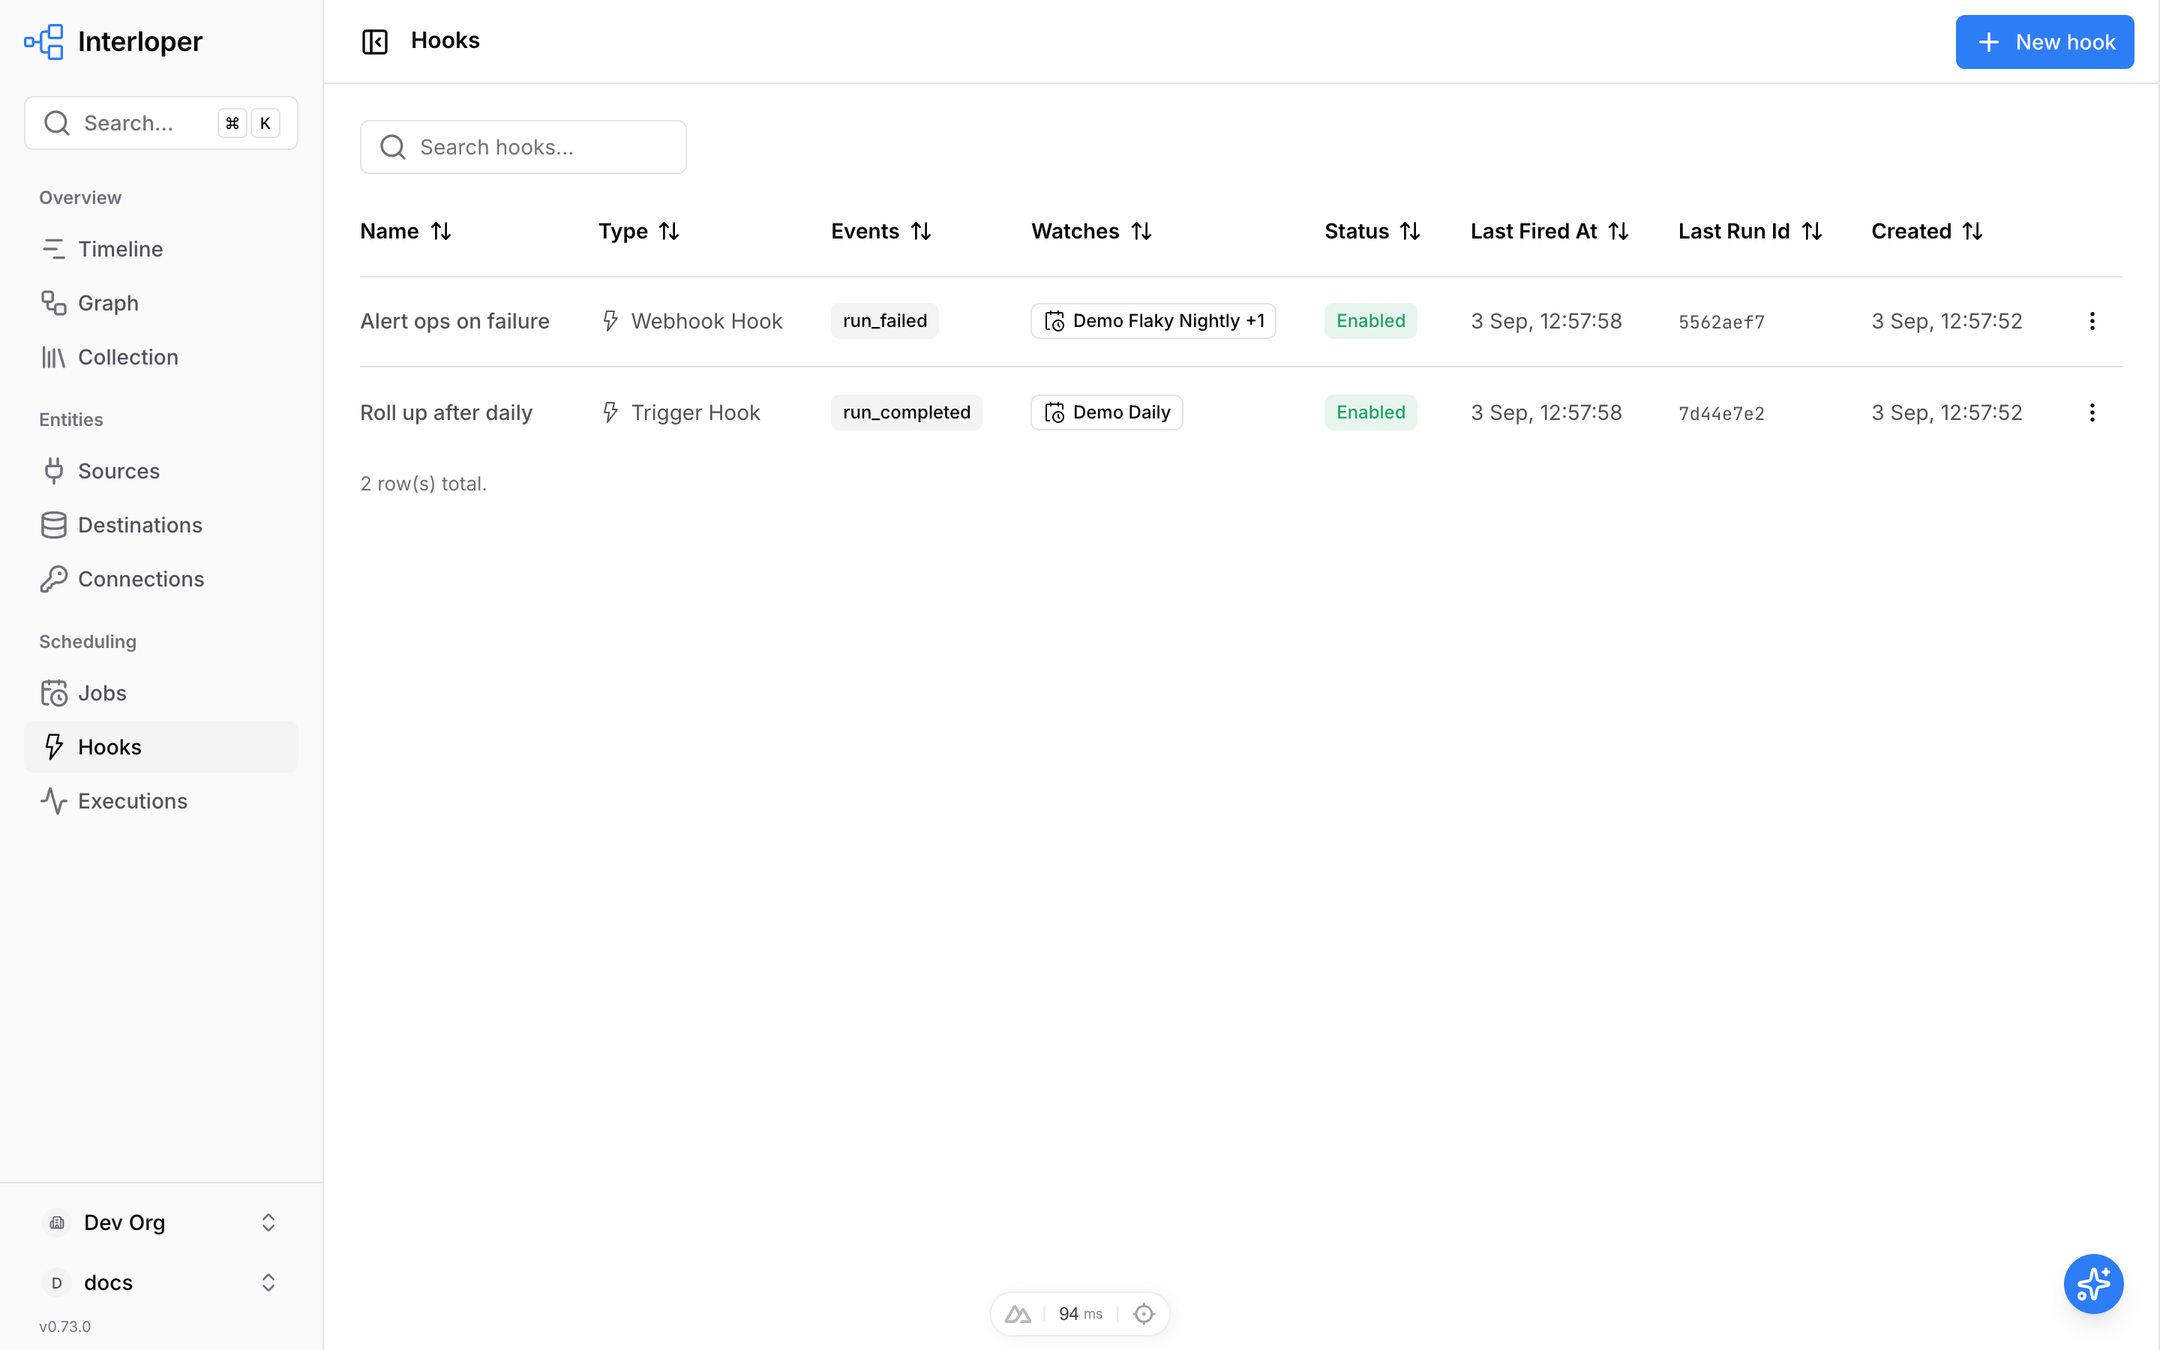
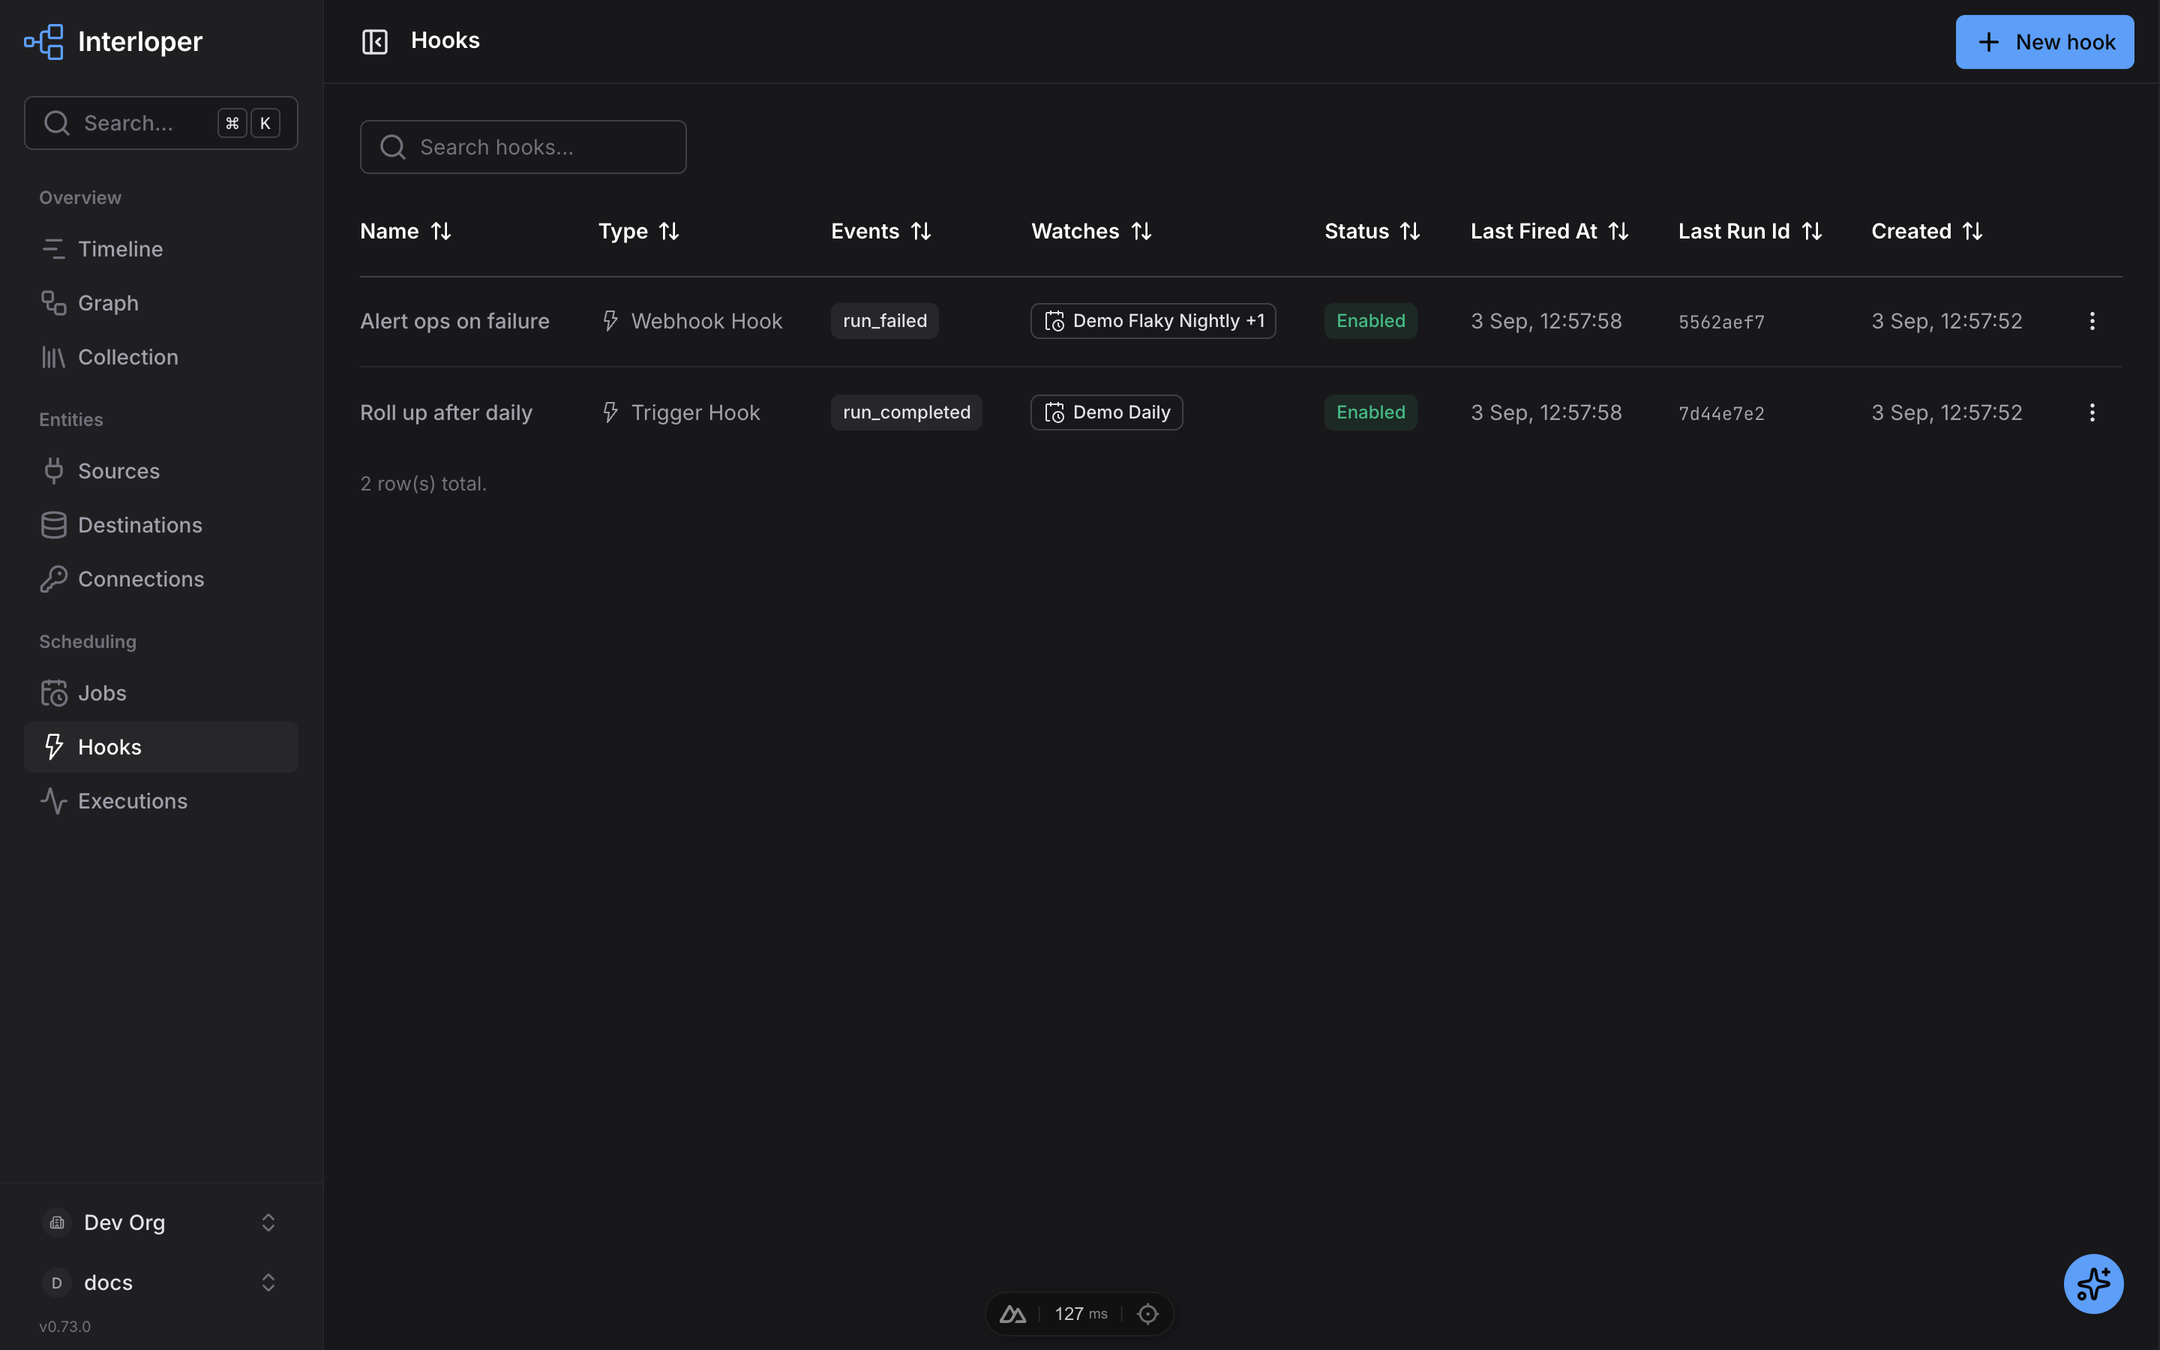
Reactions to run and backfill outcomes: a webhook posting failures to an operations endpoint, and a trigger hook starting the monthly rollup when the daily job completes. The watched components and, for trigger hooks, the targets are relation pickers derived from the hook class's vocabulary.
Executions
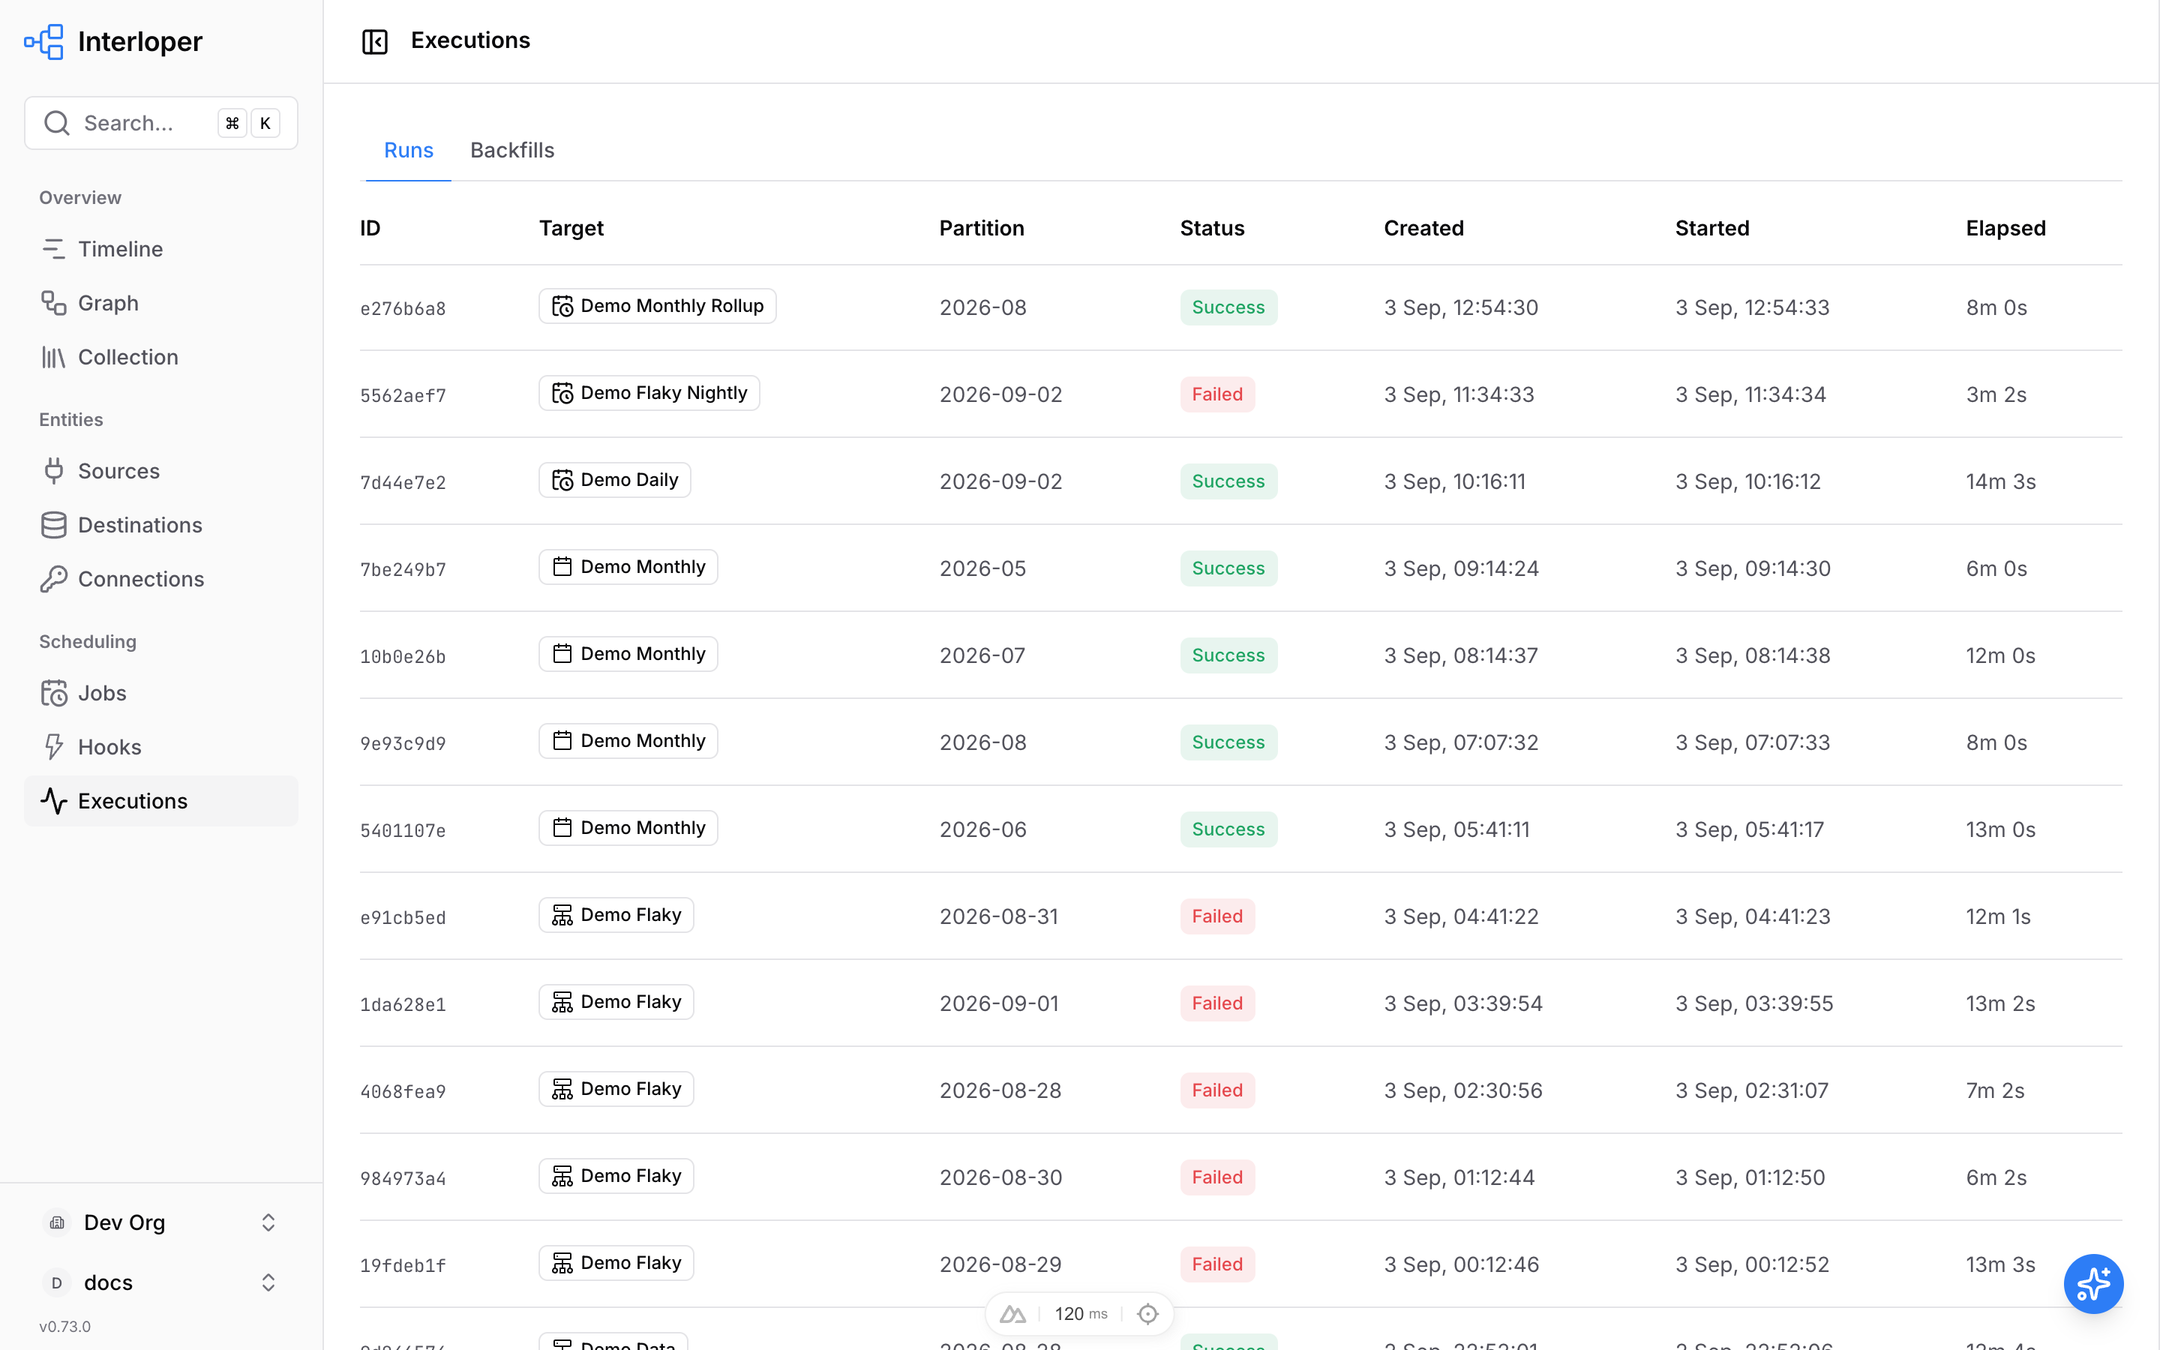
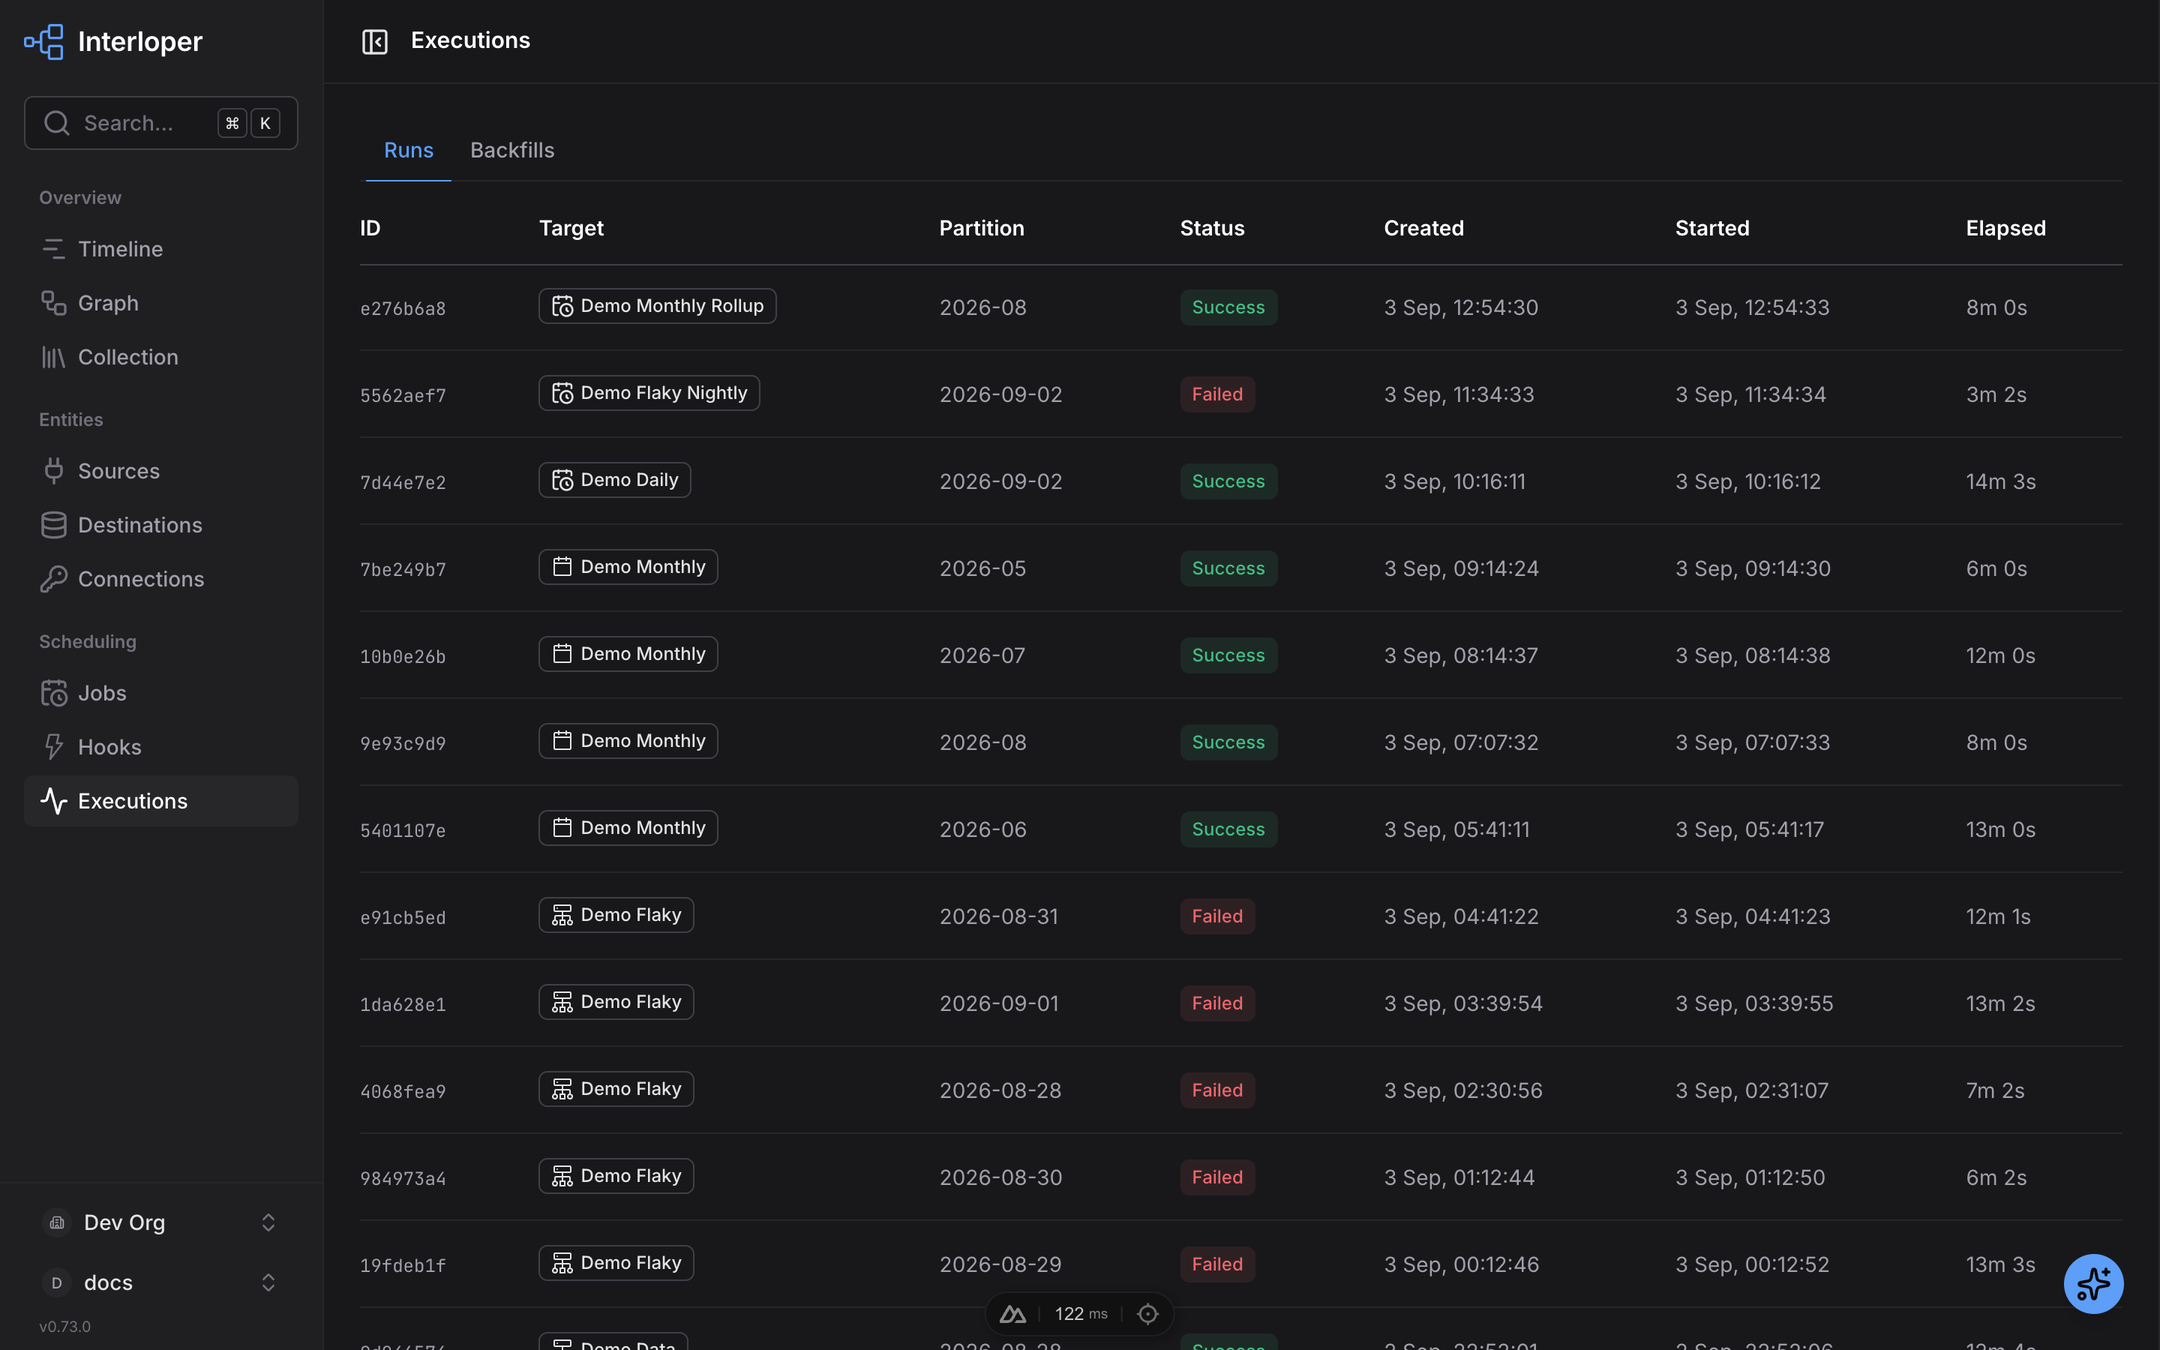
Every run with its target, partition key, status and timings. Runs come from schedules, manual triggers, hooks and backfills.
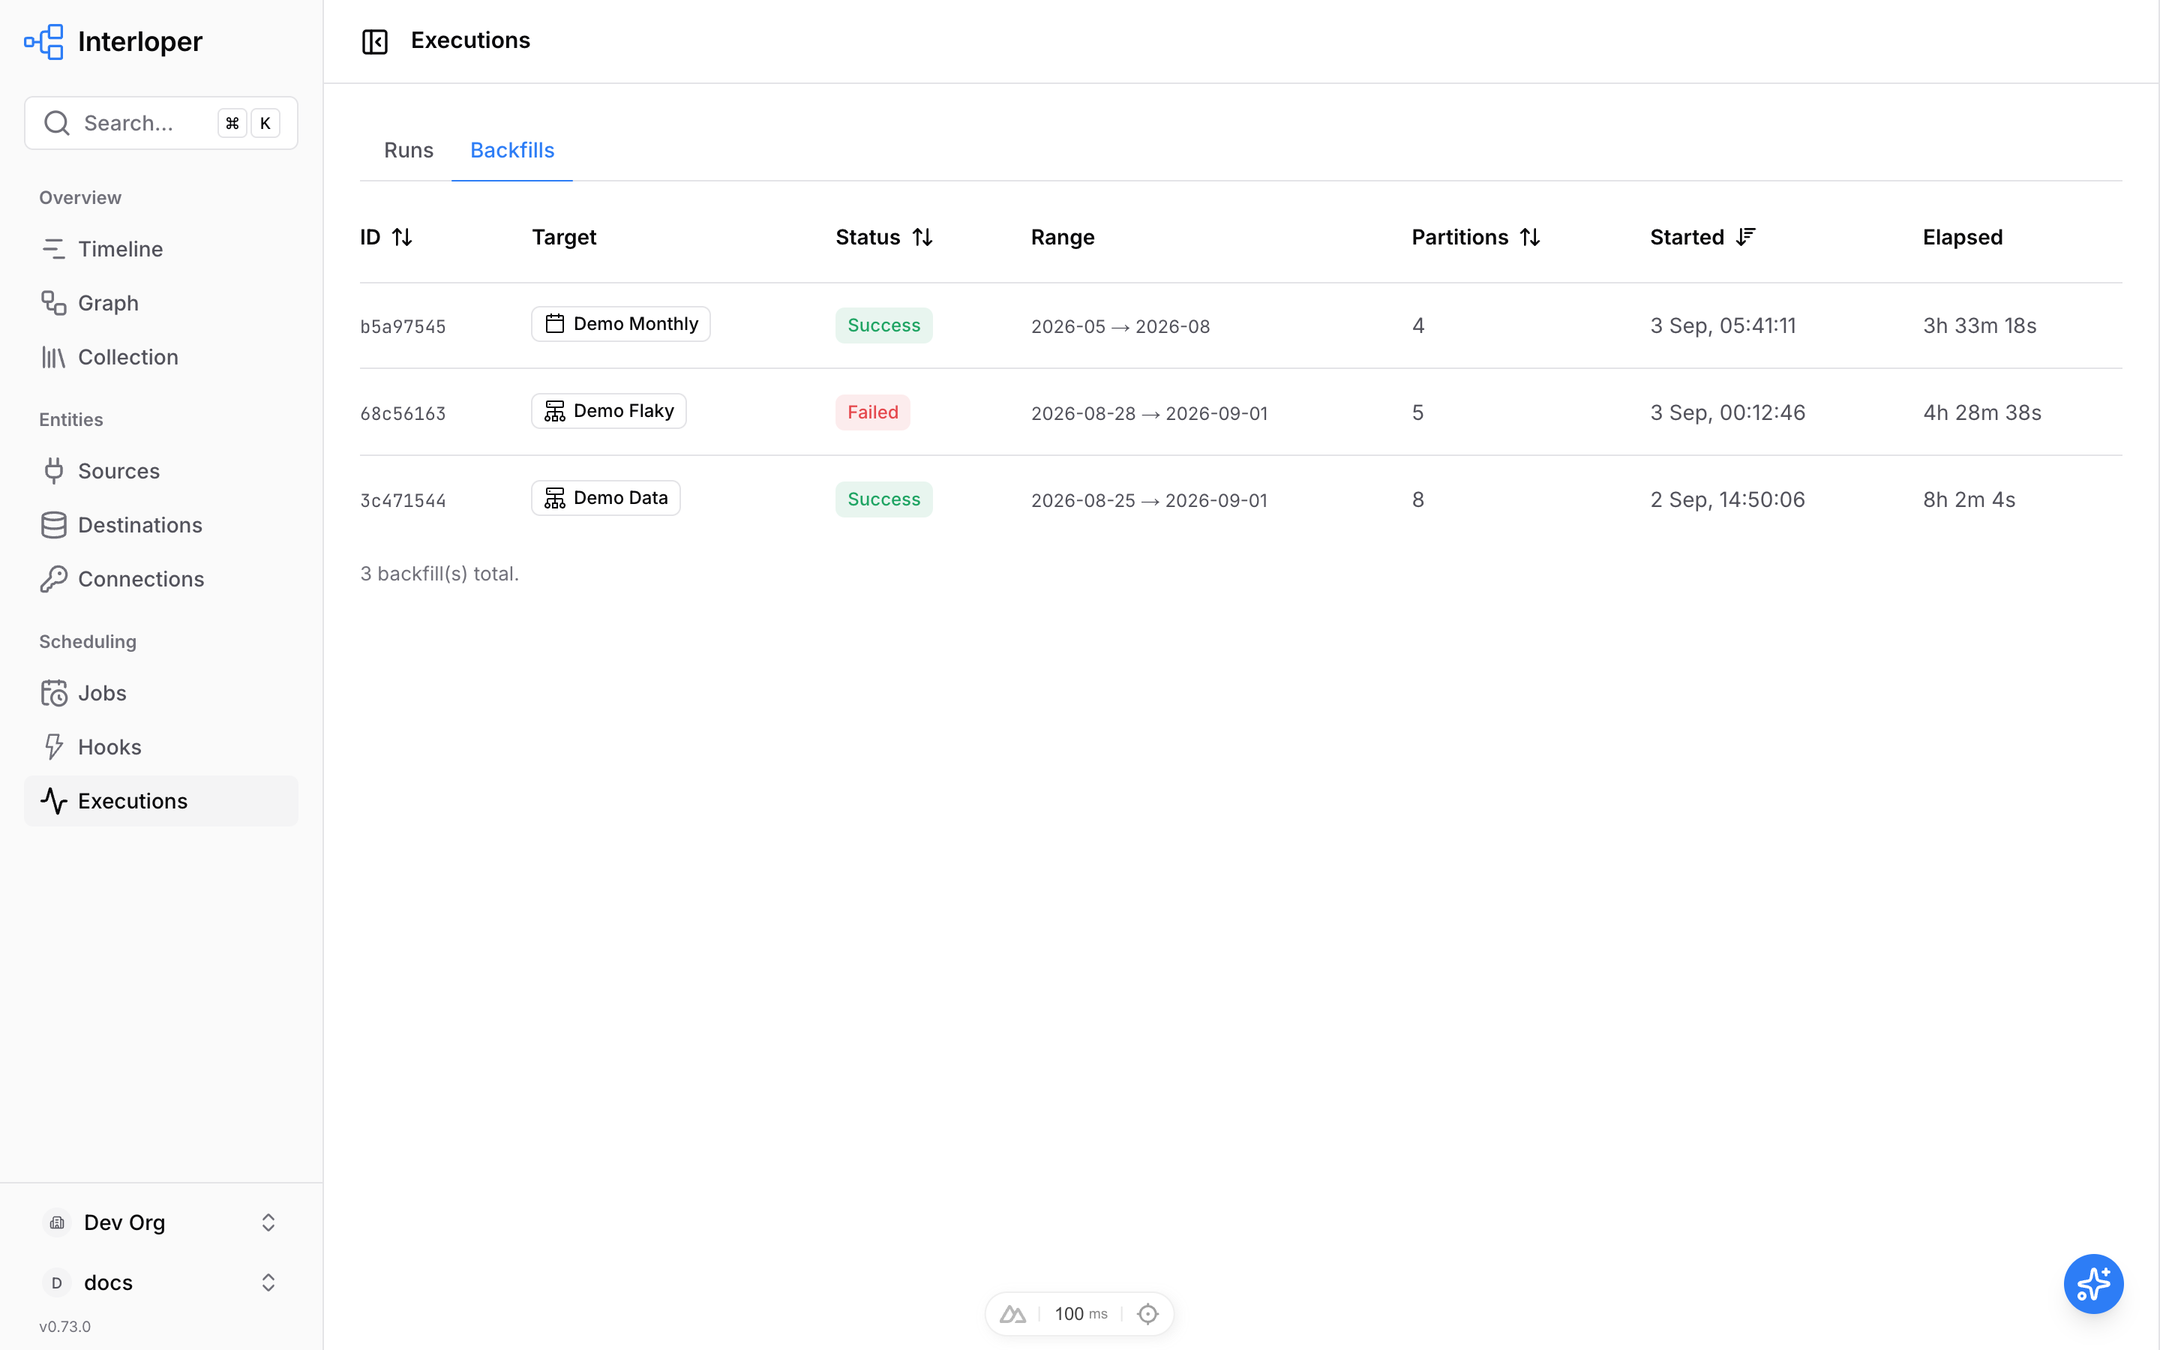
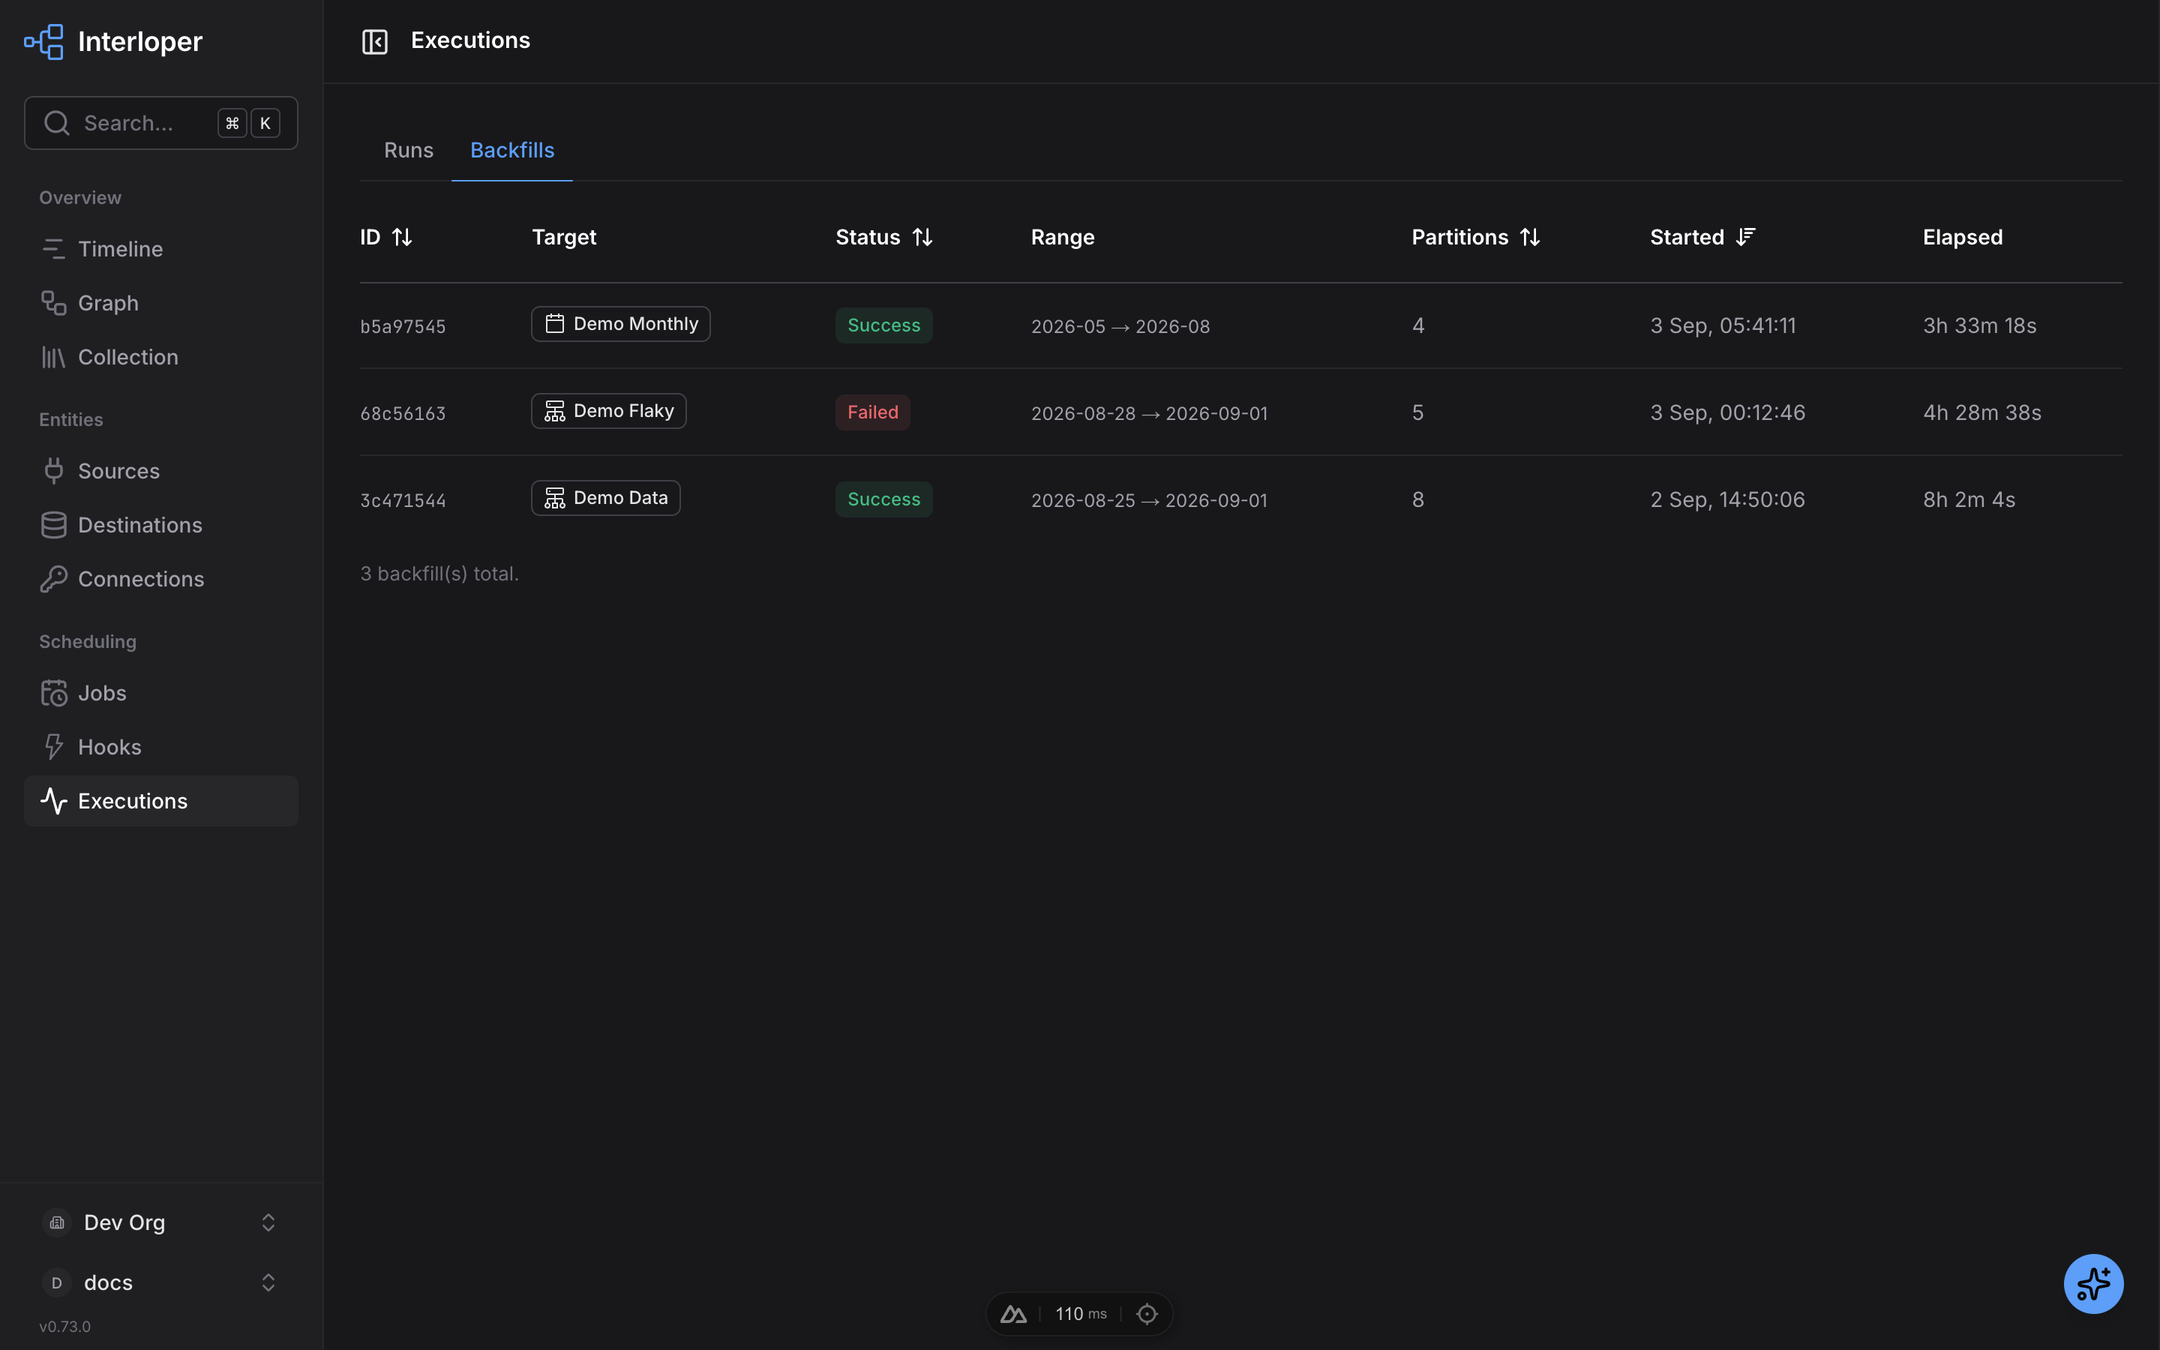
A backfill is one run per partition over a range, dispatched newest first with a concurrency cap; the range is shown in the target's partition-key shape, and the Partitions column draws each partition's latest attempt by status, the same bar the runs table draws for a run's assets. Both tables filter by status, and a status still executing spins.
Run detail
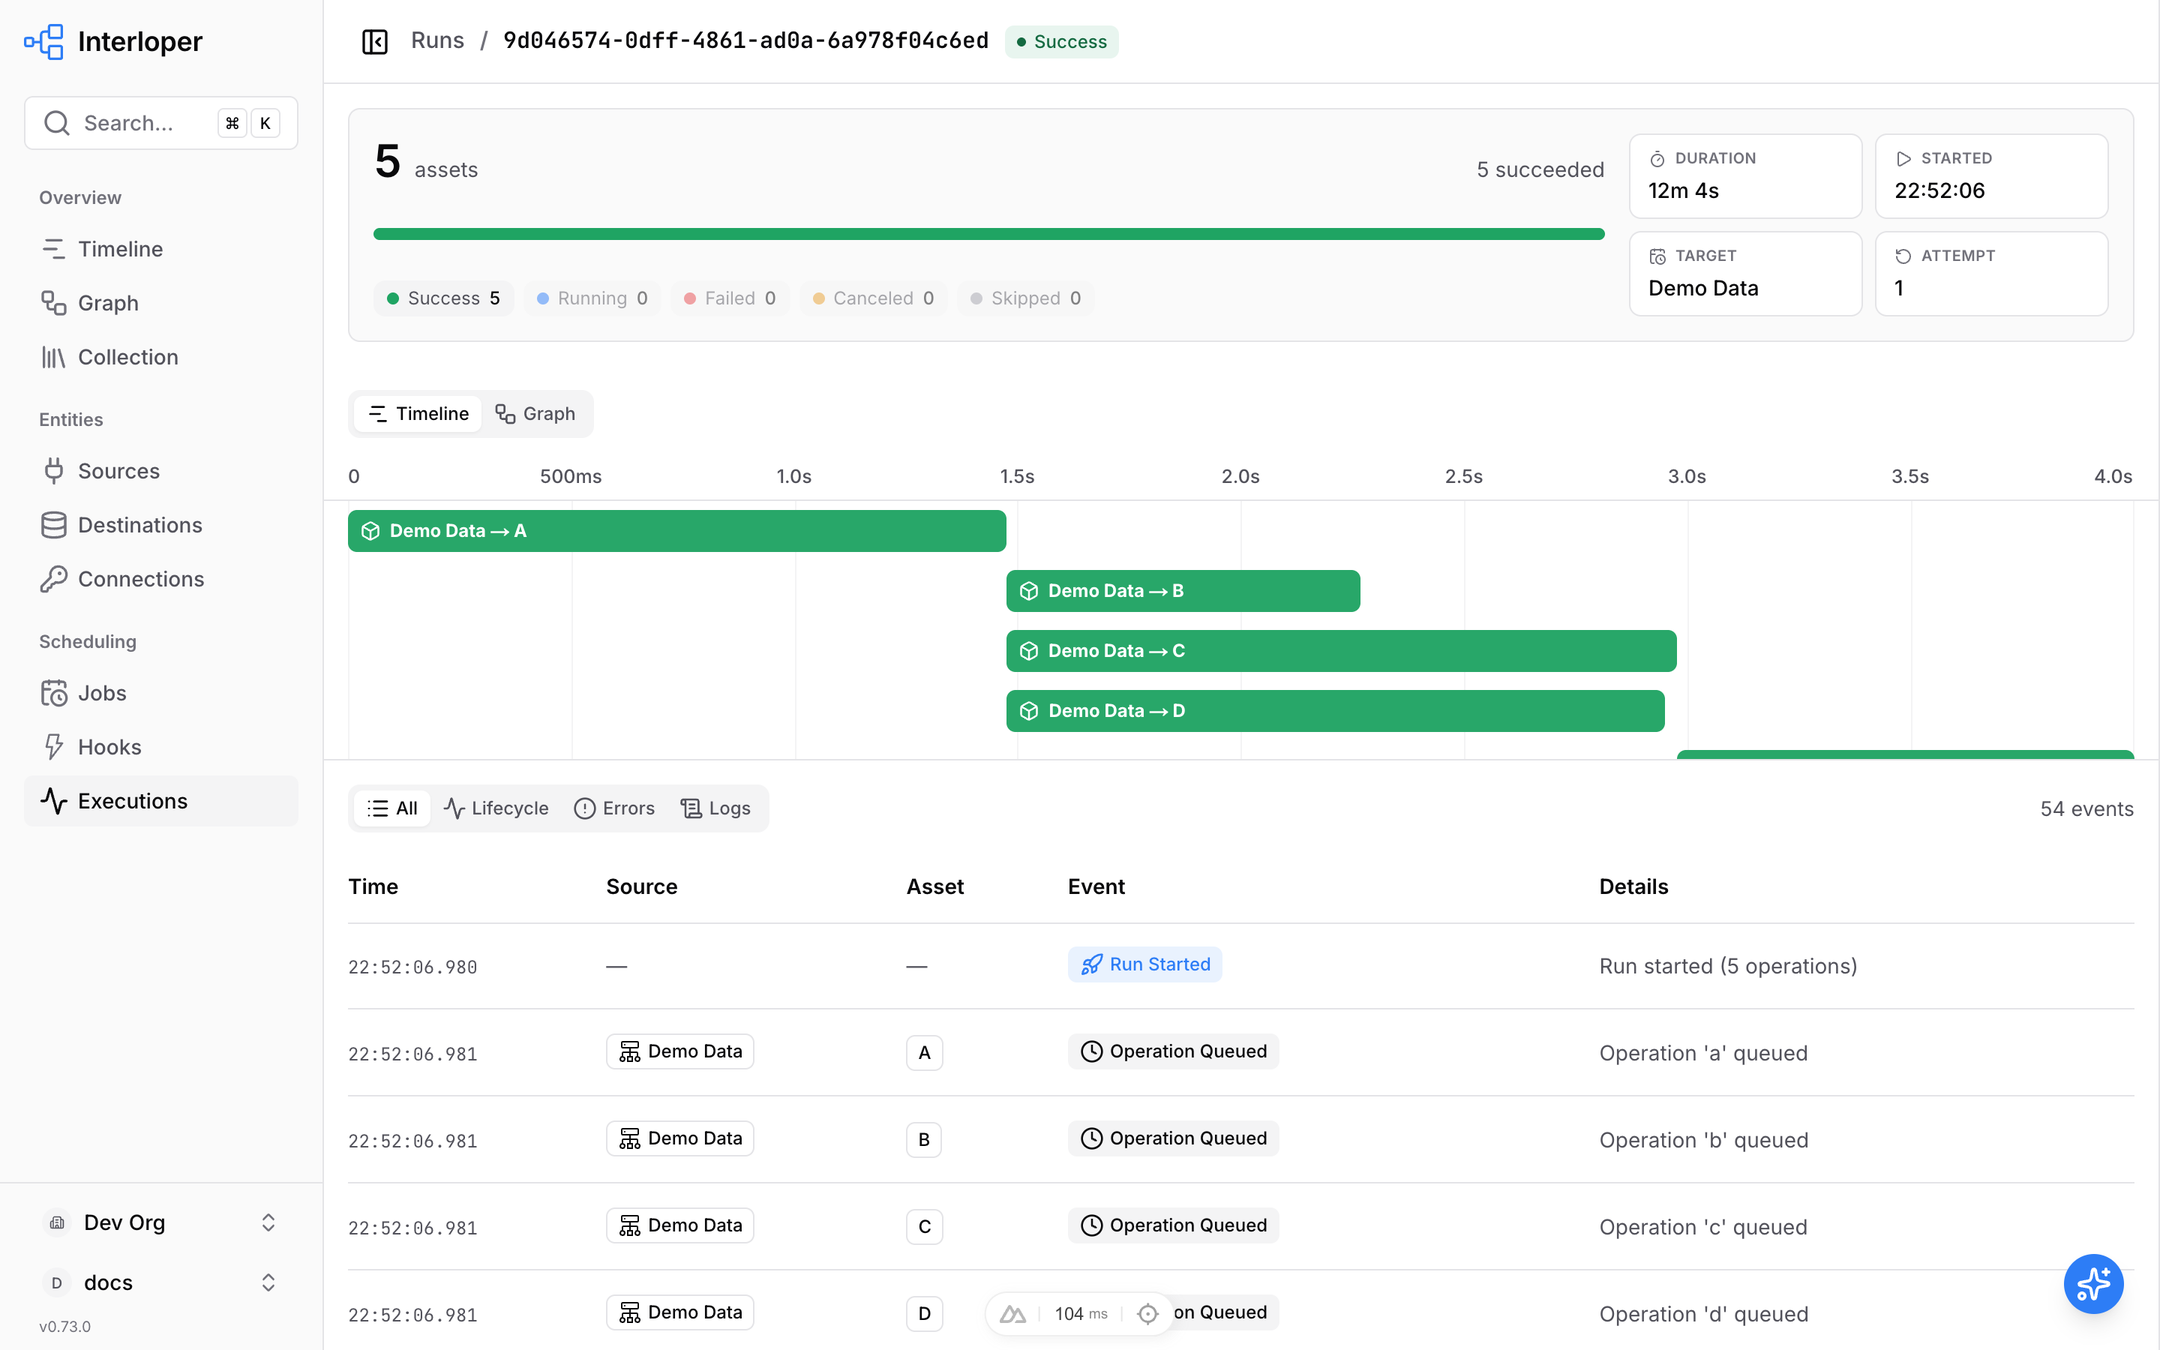
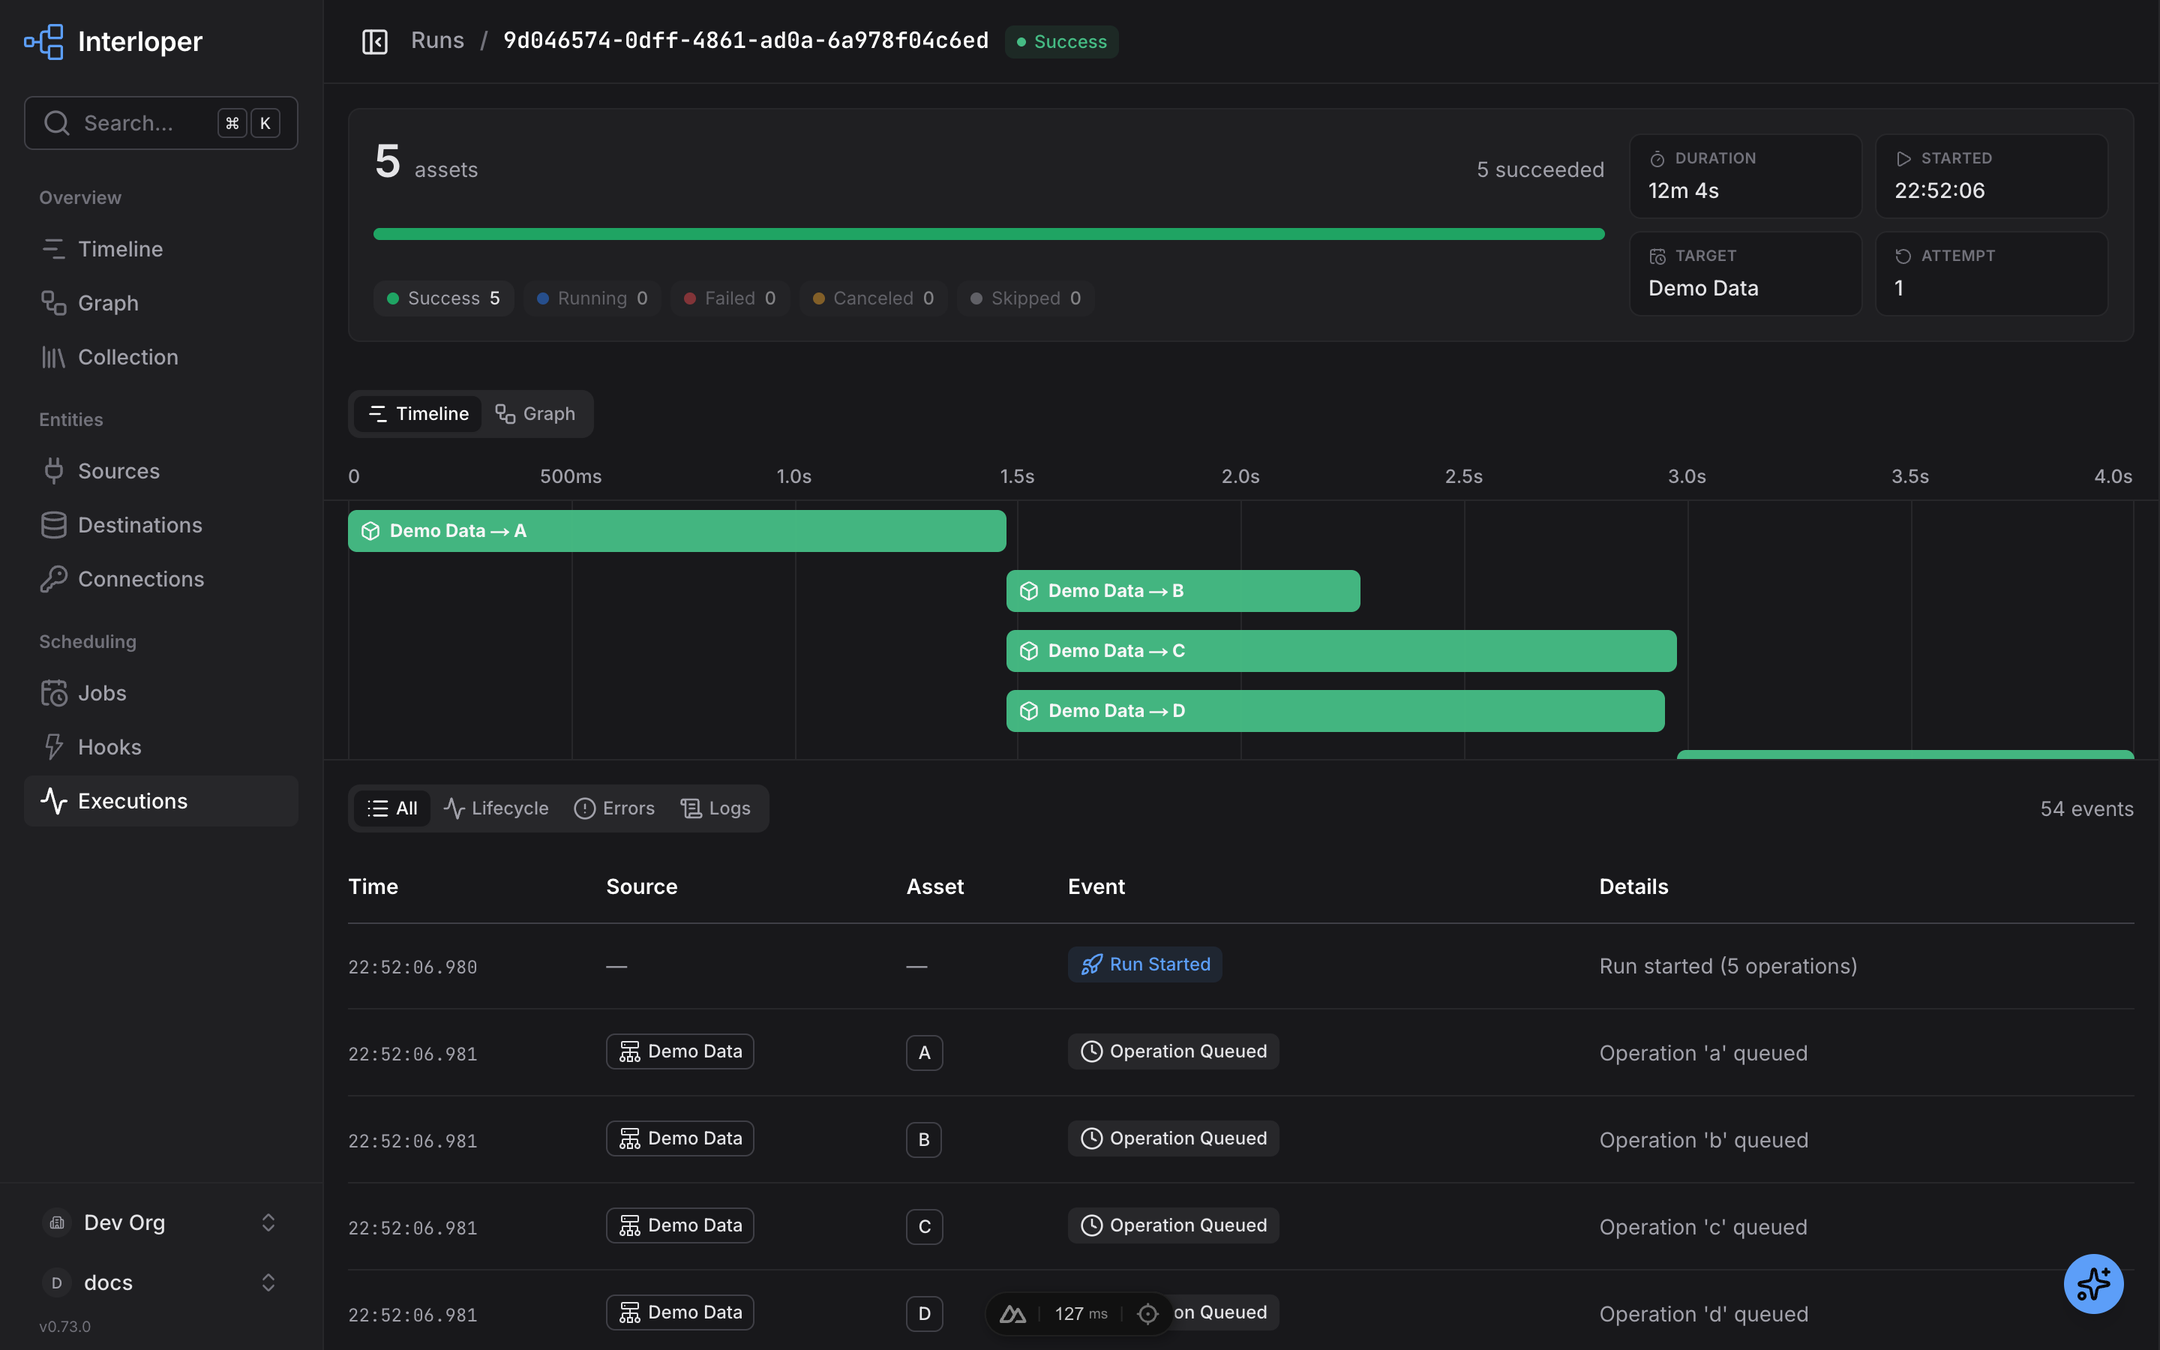
One run: the per-asset execution timeline (or the run's graph), and the full event stream the
framework emitted, filterable to lifecycle events, errors or the log lines assets wrote through
context.logger. A stack's latest attempt, when it failed, offers "Retry failed" and "Retry all".
Search and switching
The search box (⌘K) opens a command palette over every page, source, job and hook, with
aliases (typing "DAG" finds the graph). The footer switches the organisation and the user, and
toggles light and dark mode.